Use a graph to estimate a solution in context
By UK GCSE Mathematics · independent study · myAudience
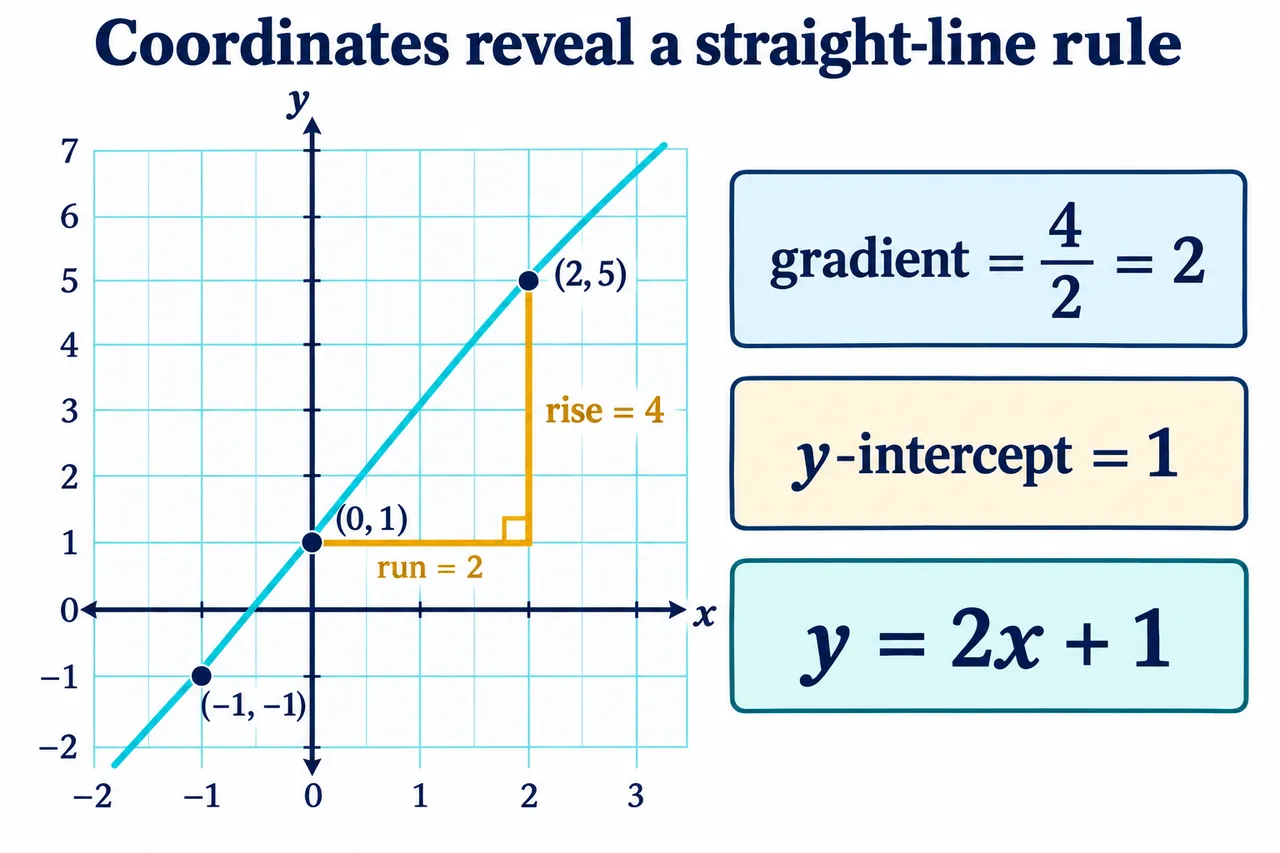
Original myAudience mathematics teaching illustration; labels, relationships and lesson calculations independently checked. · Original project artwork; no exam-board figures or textbook illustrations reused.
Use a graph to estimate a solution in context
A graph can show when a model reaches a chosen output. Draw a horizontal line at the target value and read the corresponding input at its intersection with the model. An intersection of two model graphs represents an input where their outputs agree.
The answer must be interpreted in the context and domain. A negative time or a fraction of an indivisible object may not be permitted. A plotted solution is usually approximate; retain units and state the precision supported by the scale.
Models can be non-standard, such as a piecewise tariff or measured cooling curve. Use the rule appropriate to each region. Do not continue a straight segment through a change in the process merely because the extension looks convenient.
Worked example: Use y = 2x + 1 to find the input giving output 5.
Locate output 5 on the vertical axis.
Read the input where its horizontal line meets the graph.
Check by substituting into the rule.
Answer: x = 2, confirmed by 2 × 2 + 1 = 5.
Check your understanding: Why can a graph reading differ slightly from an exact equation solution?
Answer: Its scale and plotting precision are limited.
Why: A graphical estimate is not automatically an exact algebraic value.