Distinguish position-time and velocity-time graphs
By UK GCSE Mathematics · independent study · myAudience
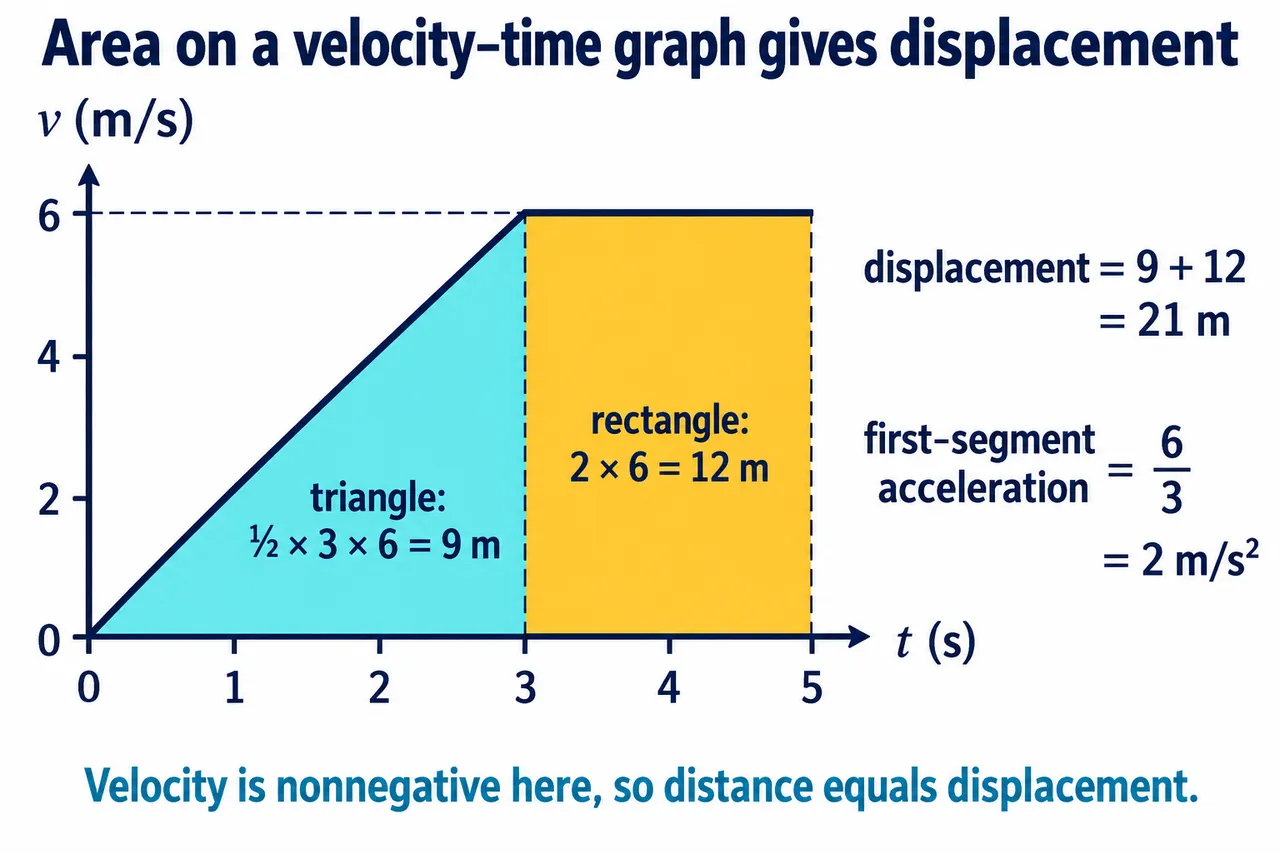
Original myAudience mathematics teaching illustration; labels, relationships and lesson calculations independently checked. · Original project artwork; no exam-board figures or textbook illustrations reused.
Distinguish position-time and velocity-time graphs
A graph label tells you what its height represents. On a distance-time graph, height is distance and gradient represents speed during an interval. On a velocity-time graph, height is velocity: a horizontal segment can mean steady motion rather than rest.
In the illustrated velocity-time model, velocity rises from 0 to 6 m/s during the first three seconds and remains 6 m/s for the next two. The first segment represents changing velocity; the second represents constant velocity. These statements come from the axes, not the shape alone.
Use the actual time interval when interpreting a segment. A model can describe only the period shown, so extrapolating beyond five seconds requires an additional assumption. Negative velocity, if present, would describe motion in the opposite chosen direction.
Worked example: Describe the motion from t = 3 s to t = 5 s.
Read the vertical value on the horizontal segment.
Use the velocity-axis units.
Answer: Constant velocity of 6 m/s for two seconds.
Check your understanding: Does a horizontal velocity-time segment necessarily mean the object is stationary?
Answer: No.
Why: It is stationary only if that segment has velocity zero.