Recognise exponential growth and decay
By UK GCSE Mathematics · independent study · myAudience
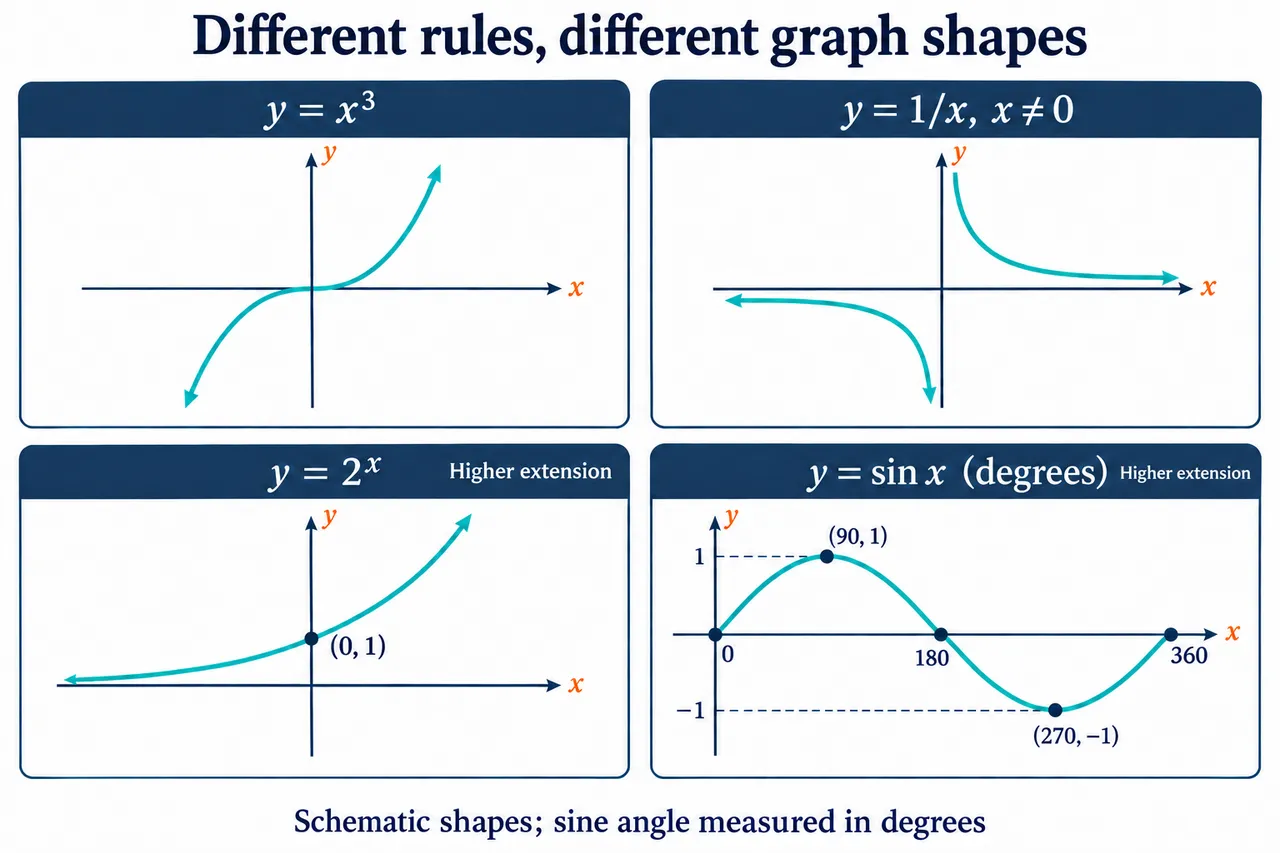
Original myAudience mathematics teaching illustration; labels, relationships and lesson calculations independently checked. · Original project artwork; no exam-board figures or textbook illustrations reused.
Recognise exponential growth and decay
In an exponential rule y = kˣ, the variable is the exponent, not a factor multiplying k. For k > 1 the graph grows as x increases; for 0 < k < 1 it decreases. If k = 1, every output is 1, so the graph is constant.
For every positive base, k⁰ = 1. The graph therefore passes through (0, 1), and its outputs remain positive. Growth by equal multiplicative factors over equal input intervals distinguishes an exponential from a linear rule.
For y = 2ˣ, inputs −1, 0, 1, 2 give 1/2, 1, 2, 4. Its gradient changes, and the curve approaches the horizontal axis on the left without reaching zero. A sketch should preserve that behaviour rather than join points with one straight line.
Worked example: Find the outputs of y = (1/2)ˣ for x = 0, 1, 2.
Apply the power to the entire fraction.
Compare successive outputs.
Answer: 1, 1/2, 1/4; each step halves the output.
Check your understanding: Does y = 2x mean the same thing as y = 2ˣ?
Answer: No.
Why: One is linear multiplication; the other has a variable exponent.