Translate and reflect a whole function graph
By UK GCSE Mathematics · independent study · myAudience
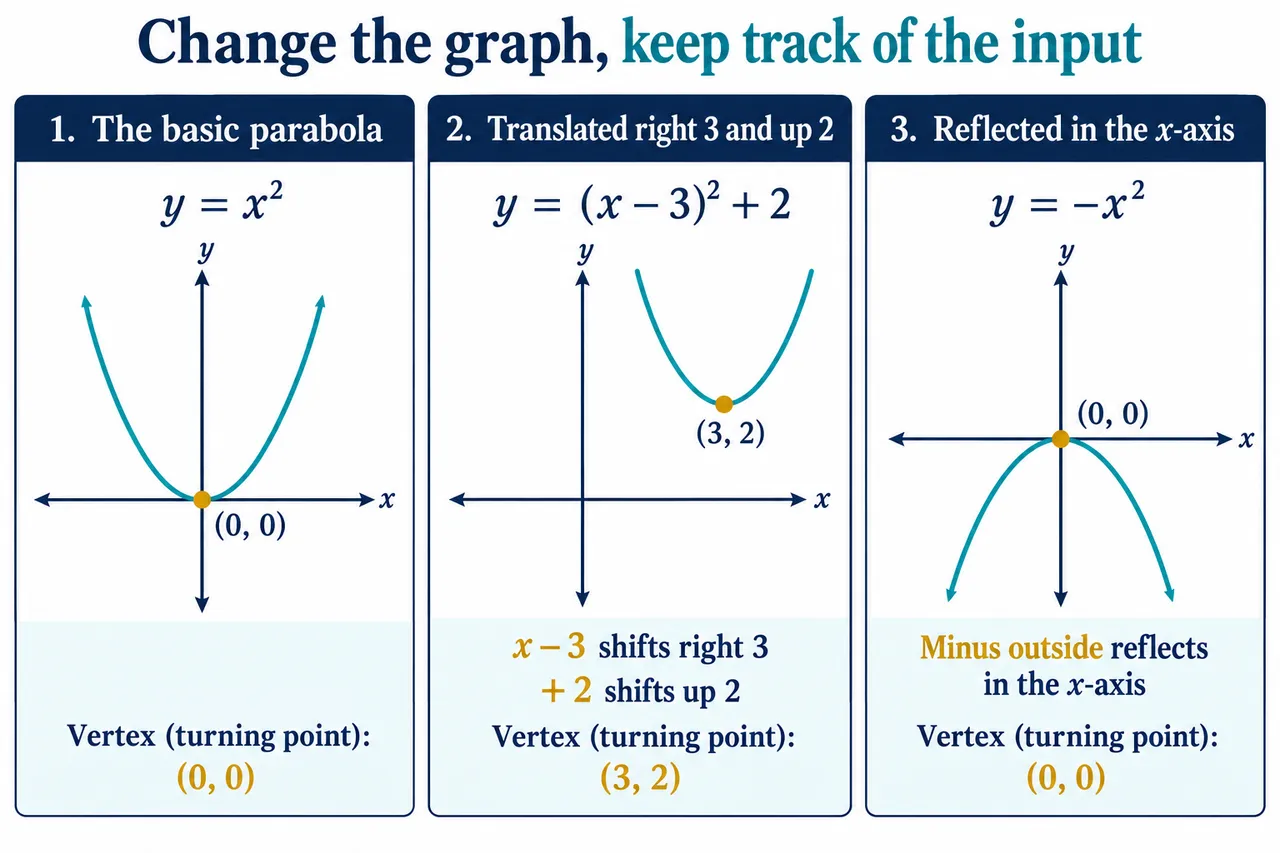
Original myAudience mathematics teaching illustration; labels, relationships and lesson calculations independently checked. · Original project artwork; no exam-board figures or textbook illustrations reused.
Translate and reflect a whole function graph
Adding a constant outside a function changes its outputs. The graph y = f(x) + 2 moves up two units. Changing the input has the opposite horizontal sign: y = f(x − 3) moves right three units, because the old input zero now occurs when x = 3.
An outside minus sign reflects the graph in the x-axis: y = −f(x) reverses output signs. A minus sign on the input reflects in the y-axis: y = f(−x). Follow known points to verify which coordinate has changed.
For f(x) = x², the graph y = (x − 3)² + 2 has turning point (3, 2). A reflection in the y-axis leaves x² looking unchanged because the original function is even; that symmetry should not be mistaken for a rule that all reflections do nothing.
Worked example: Describe y = (x + 4)² − 1 relative to y = x².
The input x + 4 is zero at x = −4.
The outside −1 reduces every output by one.
Answer: Translate four units left and one unit down.
Check your understanding: Where is the vertex of y = −x²?
Answer: (0, 0), now a maximum.
Why: The reflection reverses outputs but leaves the origin fixed.