Interpret an exponential graph in a real context
By UK GCSE Mathematics · independent study · myAudience
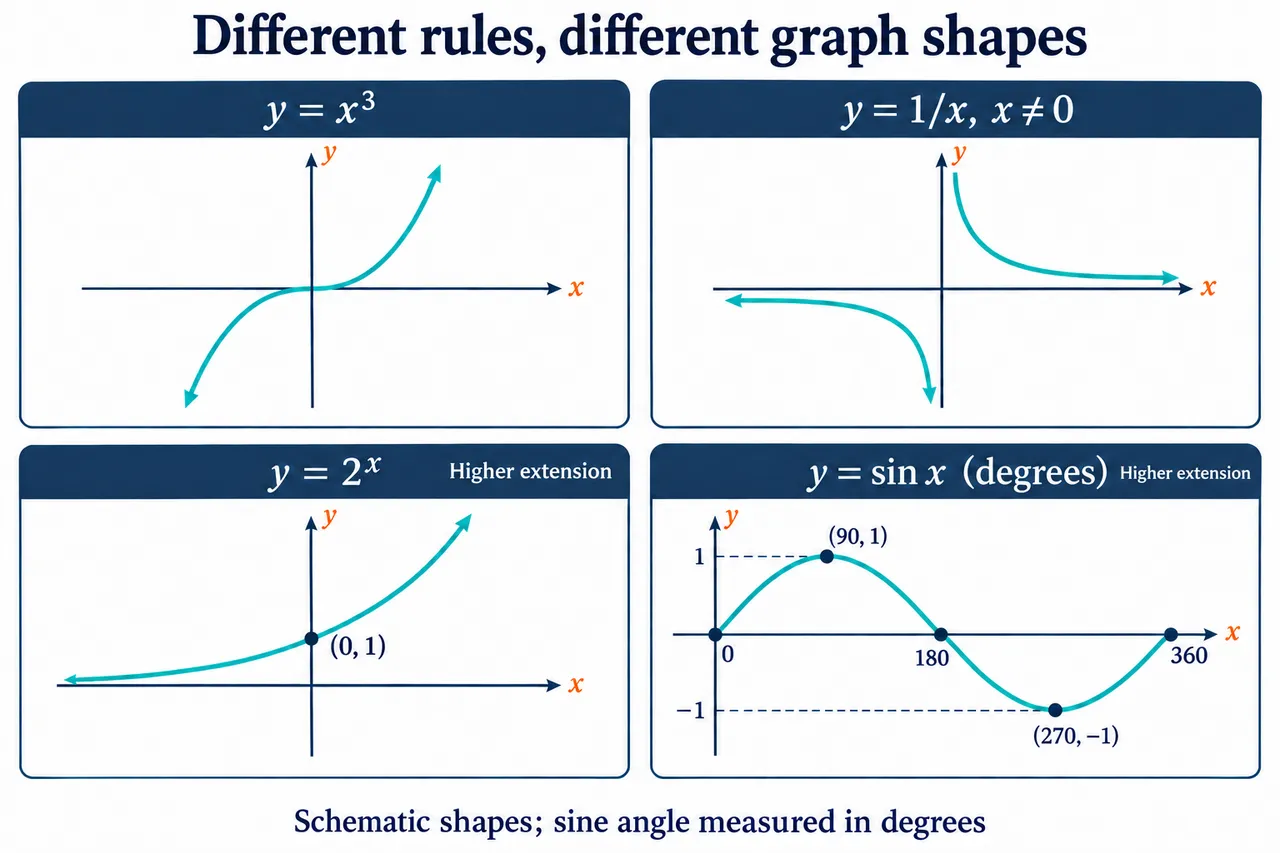
Original myAudience mathematics teaching illustration; labels, relationships and lesson calculations independently checked. · Original project artwork; no exam-board figures or textbook illustrations reused.
Interpret an exponential graph in a real context
A repeated percentage change can give an exponential model. Starting with 80 units and increasing by 25% each step gives y = 80 × 1.25ⁿ. The multiplier stays fixed, but the absolute amount added grows because it is a percentage of the new total.
A graph can estimate when the model reaches a threshold. Whether fractional inputs are meaningful depends on the process: a continuous model can use fractional time, while a rule applied only after whole monthly updates may require a whole-number step.
An exponential model is an assumption about the process, not a promise of unlimited real growth. Population, financial and cooling contexts need their own limitations and units. State the range over which the model is intended to apply.
Worked example: A model doubles every hour from 12. Find the amount after three hours.
Use y = 12 × 2ⁿ.
Substitute n = 3.
Answer: 96 units.
Check your understanding: Does doubling mean adding 12 every hour?
Answer: No.
Why: The new amount is multiplied by two, so successive increases change.