Calculate and estimate area under a graph
By UK GCSE Mathematics · independent study · myAudience
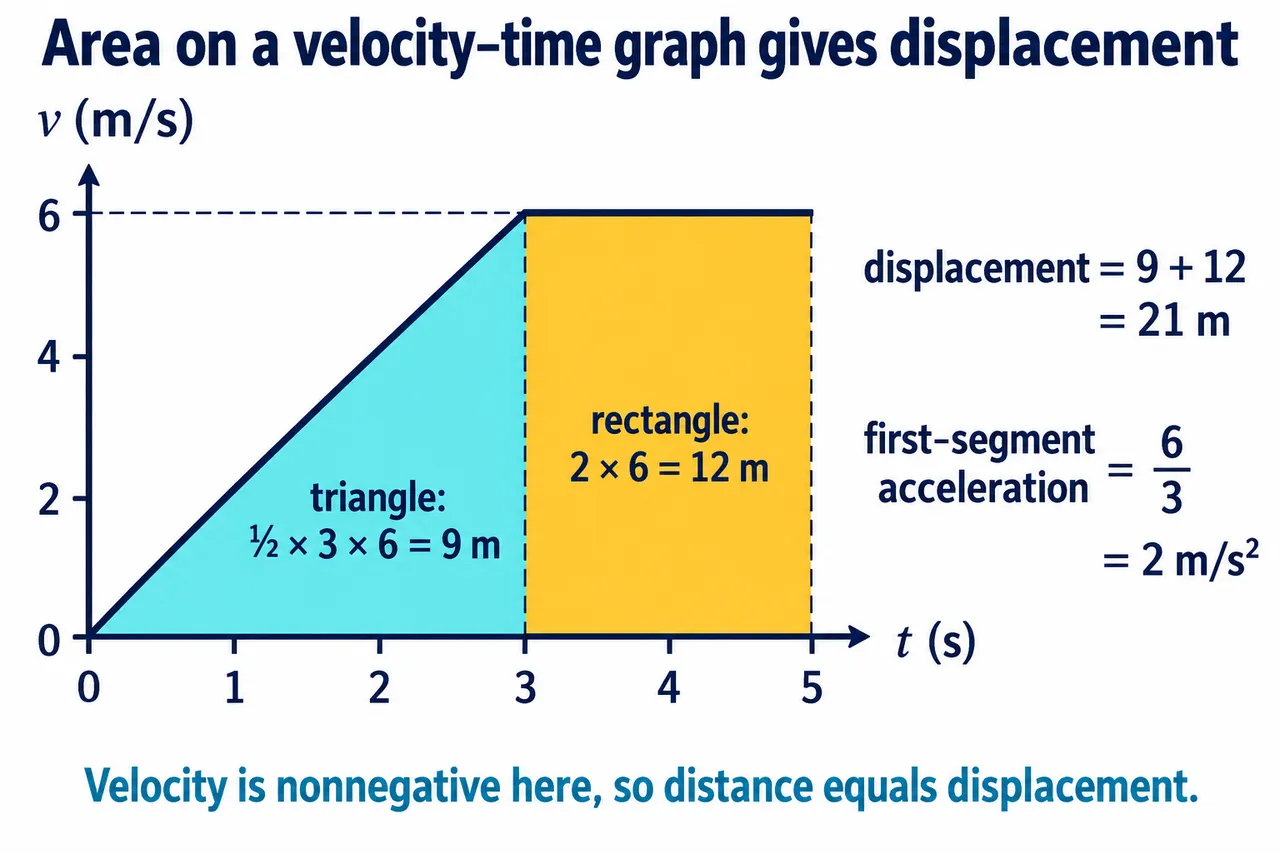
Original myAudience mathematics teaching illustration; labels, relationships and lesson calculations independently checked. · Original project artwork; no exam-board figures or textbook illustrations reused.
Calculate and estimate area under a graph
On a velocity-time graph, signed area gives displacement. A triangular region from 0 to 3 seconds rising from 0 to 6 m/s has area (1/2) × 3 × 6 = 9 m. The following rectangle lasts two seconds at 6 m/s and adds 12 m.
When velocity remains nonnegative, distance and displacement agree. With negative velocity, an area below the axis contributes negative displacement; total distance instead uses the magnitudes of the separate areas. Label the required quantity before adding.
For a curved boundary, strips or trapezia give an estimate. For a trapezium of width h with parallel heights a and b, the area is h(a + b)/2. Smaller strips can improve an estimate, but a drawing alone does not prove whether it is an overestimate or underestimate without examining the curve.
Worked example: Find displacement in the illustrated five-second model.
Triangle: 1/2 × 3 × 6 = 9 m.
Rectangle: (5 − 3) × 6 = 12 m.
Add the nonnegative areas.
Answer: 21 m.
Check your understanding: What are the area units when velocity is in m/s and time in s?
Answer: Metres.
Why: Multiplying (m/s) by s cancels the time unit.