Recognise proportional graphs and their rate meaning
By UK GCSE Mathematics · independent study · myAudience
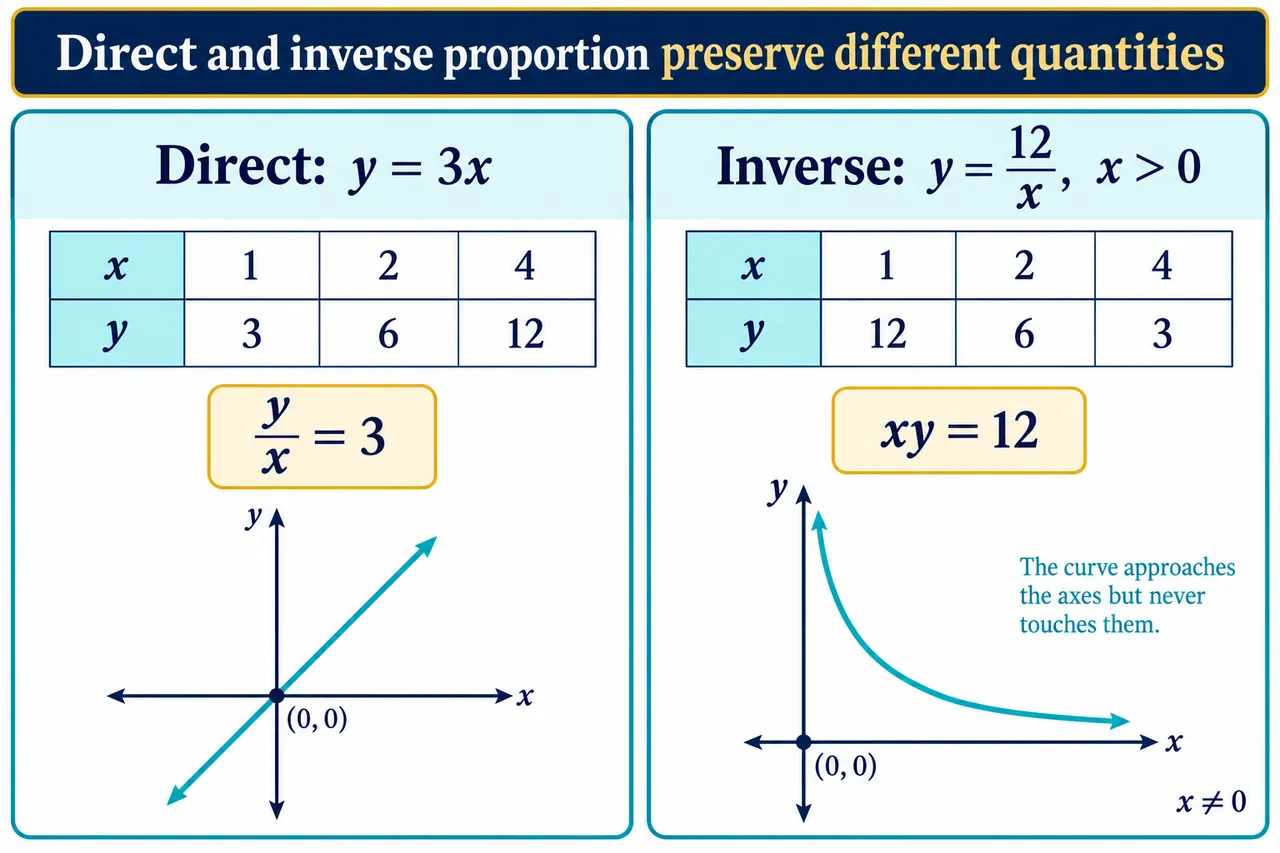
Original myAudience mathematics teaching illustration; labels, relationships and lesson calculations independently checked. · Original project artwork; no exam-board figures or textbook illustrations reused.
Recognise proportional graphs and their rate meaning
Direct proportion y = kx gives a line through the origin with gradient k. Inverse proportion y = k/x gives a reciprocal curve over the stated domain. Shape and constant relationships provide checks on each other.
The gradient of a straight-line context graph gives a rate with units from vertical change divided by horizontal change. A graph of cost against quantity can have a constant per-unit rate while also carrying a fixed charge; that graph is linear but not directly proportional.
A positive inverse-proportion graph decreases with a changing gradient. A single straight-line gradient cannot describe the whole curve. Do not infer the exact algebraic rule solely from a rough visual trend without data or a stated model.
Worked example: For y = 3x, interpret the gradient and calculate y at x = 4.
The coefficient of x is the constant gradient.
Multiply the input by 3.
Answer: Gradient 3; output 12.
Check your understanding: Which graph passes through the origin: y = 3x or y = 12/x?
Answer: y = 3x.
Why: The reciprocal rule is undefined at zero.