Chile and Nepal 2015: compare the evidence, not a stereotype
By UK GCSE Geography · independent study · myAudience
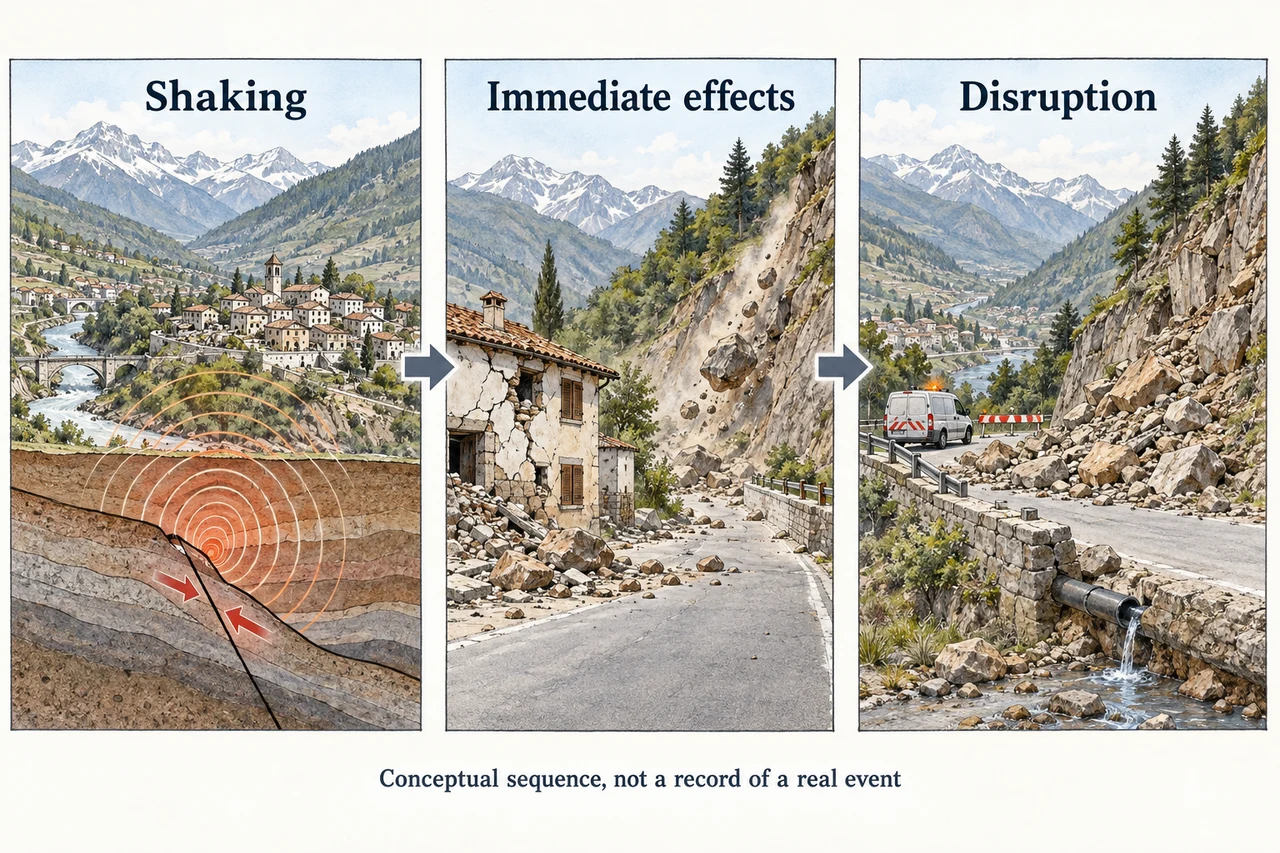
Image: illustration, not a documentary photograph. Original teaching model created for myAudience. · Original generated teaching illustration; no source textbook artwork reproduced.
Chile and Nepal 2015: compare the evidence, not a stereotype
Two 2015 events provide a dated comparison. USGS records the 25 April Gorkha earthquake in Nepal as magnitude 7.8 and the 16 September Illapel earthquake in Chile as magnitude 8.3. The Nepal event ruptured part of the Himalayan thrust system; the Chile event occurred in an oceanic subduction setting and generated a tsunami. They are not controlled experiments: the locations, depths, exposed populations and secondary hazards differ.
Income is one context variable. World Bank data retrieved on 3 October 2026 list 2015 Atlas-method GNI per person as US$14,080 for Chile and US$870 for Nepal. These are national averages in current dollars for that year, not each household’s earnings or a direct measure of building safety. Do not relabel a 2015 event using a country’s present-day income category. The contrast supports questions about resources and capacity, not the claim that wealth alone determines loss.
UNESCO’s 17 September 2015 Chile report describes tsunami warnings and evacuation of nearly one million people, citing Chile’s emergency authority; it also discusses building standards and regional coordination. It is an early event report, so its preliminary casualty figures should not be treated as final totals. In Nepal, the World Bank’s September 2020 reconstruction review describes homeowner-led grants, technical support and training for engineers and masons. That is evidence about a longer-term recovery programme, not the speed of first-day rescue.
The earlier Nepal landslide example helps explain how steep terrain and damaged access can obstruct response. Chile’s coastal evacuation illustrates a different problem: getting people away from tsunami exposure. A strong comparison links a named impact to a named response and identifies the limits of each source. To compare effectiveness quantitatively, obtain like-for-like, dated outcomes; do not subtract incomparable early evacuation and later reconstruction counts.
Worked example: Using the retrieved 2015 GNI values, estimate Chile’s value relative to Nepal’s. Does the result mean Chilean households had that many times the disaster protection?
Calculate 14,080÷870≈16.18.
Round to about 16.2 times, naming the measure and year.
An income average cannot directly measure household protection, enforcement or the hazard experienced.
Answer: About 16.2 times the national GNI-per-person measure; it does not establish a 16.2-times protection advantage.
Check your understanding: Can an early report’s preliminary death count be compared directly with a later review’s final reconstruction total?
Answer: No; they measure different outcomes and stages of reporting.
Why: Comparison requires aligned categories, dates and definitions. Source criticism is part of geographical explanation, not an optional footnote.