Storm Babet 2023 and the evidence for UK extremes
By UK GCSE Geography · independent study · myAudience
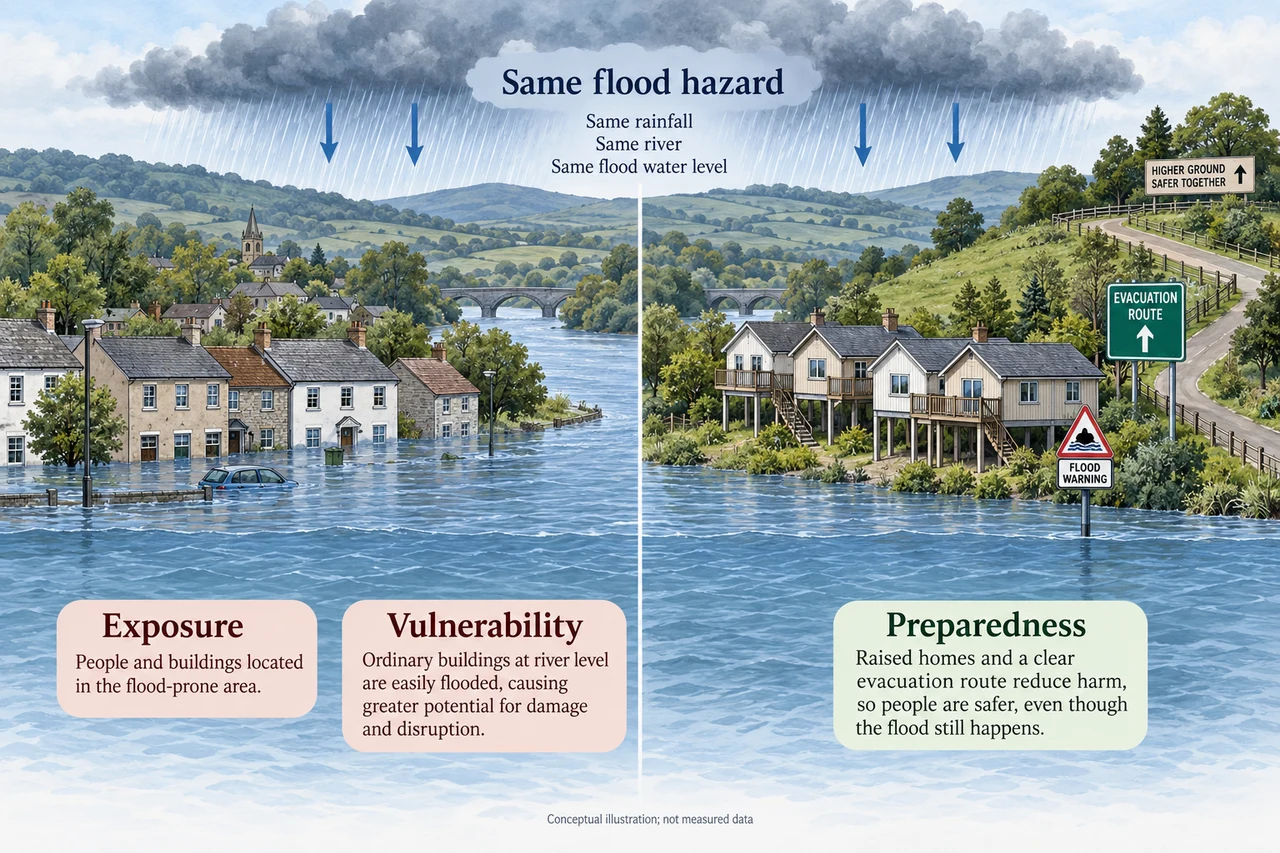
Image: illustration, not a documentary photograph. Original teaching model created for myAudience. · Original generated teaching illustration; no source textbook artwork reproduced.
Storm Babet 2023 and the evidence for UK extremes
The UK experiences heavy rain, strong winds, heatwaves, drought, snow and ice. Storm Babet brought exceptional rainfall and strong winds to parts of eastern Scotland and prolonged widespread rain elsewhere during 18–21 October 2023. Persistent rainfall can saturate ground, increase runoff and raise river levels; wind can add damage and disruption. A storm’s name identifies an event, not one identical intensity across the country.
The Environment Agency’s 2023–24 flood-risk report describes hundreds of warnings and alerts, temporary barriers and pumps during Babet, and estimates that flood defences protected around 97,000 properties. Those are operational estimates in an England-focused agency report, not a full UK loss inventory. A property protected and a warning issued are different measures. Reports written during the event and later reviews may use revised counts; always preserve the reporting date and geography.
Flooded homes and interrupted travel affect people and local economies. Water can also carry pollutants, damage farmland and alter habitats. Management includes forecasts and warnings, maintained defences, emergency response and land-use or catchment measures. Evaluate costs and residual risk: a barrier has a design limit, and moving water away from one location can transfer a problem downstream. The illustration shows a generic flood comparison, not Babet’s actual streets.
One severe event cannot demonstrate a long-term trend by itself. The Met Office’s State of the UK Climate 2025 review compares decades and reports more frequent and intense temperature extremes, with wetter winter-half-year conditions over its stated periods. That supports trend analysis with defined baselines; it does not show that every year or every kind of weather must become more extreme in the same way. Event attribution is a separate statistical question about how a changing climate affects the probability or intensity of an event.
Worked example: A fictional site averages 80 mm of rain in a reference month and receives 120 mm in a four-day event. Express the event total as a share of that average. Does it mean 150% more rain?
Divide 120 by 80 and multiply by 100 to get 150% of the average.
The excess is 40 mm;40÷80×100=50% above it.
A four-day total and monthly average have different time windows; label the comparison clearly.
Answer: 150% of the reference monthly average, or 50% above it; “150% more” is incorrect.
Check your understanding: Why does a single wet October not establish the trend for every UK region?
Answer: A trend requires a consistent series across years and a defined geographic scope.
Why: Weather varies. Comparisons should hold definitions, locations and baseline periods steady before drawing climate conclusions.