Climate evidence: separate a record from an explanation
By UK GCSE Geography · independent study · myAudience
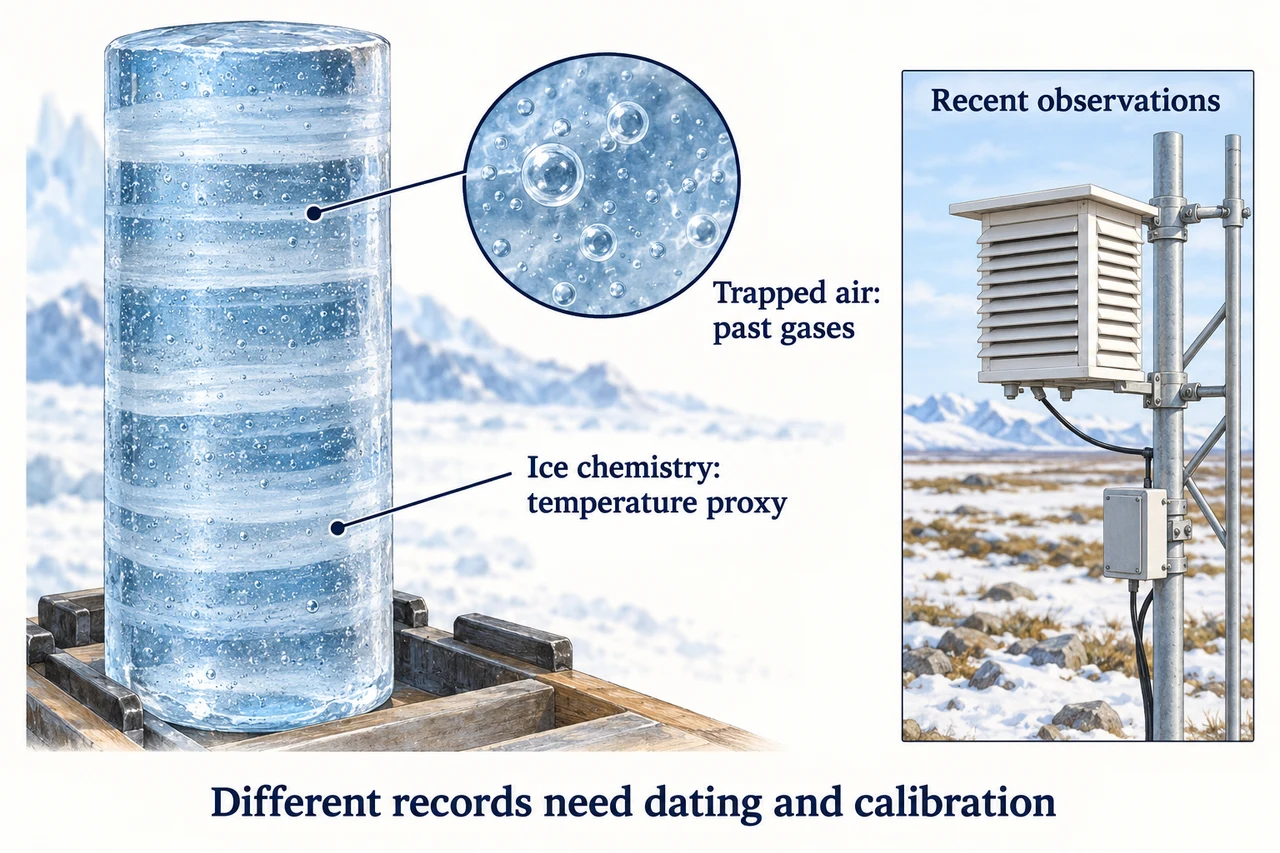
Image: illustration, not a documentary photograph. Original teaching model created for myAudience. · Original generated teaching illustration; no source textbook artwork reproduced.
Climate evidence: separate a record from an explanation
Climate describes patterns and variation over longer periods than a daily forecast. Instrument records help track recent temperatures; earlier conditions can be reconstructed from evidence such as ice cores and sediments. Ice contains trapped air that records past atmospheric gases, while chemical properties of the ice provide temperature-related proxies. A proxy needs calibration and a dating method; it is not an ancient thermometer with a modern digital display.
The Quaternary spans roughly the last 2.6 million years and includes repeated glacial and interglacial conditions. Changes in Earth’s orbit altered the distribution of solar energy, with feedbacks amplifying the response. Solar output also varies. Large eruptions can inject particles high into the atmosphere and cause temporary cooling. “Natural climate change exists” is therefore true, but it does not identify the cause of a particular modern trend.
Today’s warming is primarily driven by human greenhouse-gas emissions. Burning fossil fuels transfers long-stored carbon into the atmosphere; deforestation can release carbon and reduce its uptake, while agriculture contributes gases including methane and nitrous oxide. The greenhouse effect concerns absorption and re-emission of outgoing infrared radiation, not simply a solid lid stopping all energy leaving Earth. Physical mechanisms, measurements and model comparisons support attribution; a correlation alone is not the whole argument.
A useful evidence analysis asks three questions: what was measured, what period and place does it cover, and which explanation fits the combined observations? Compare multiple independent records rather than select a single cold winter as a rebuttal to a global trend. Equally, do not use one warm afternoon as proof of an exact future forecast. The climate-evidence illustration separates trapped gas from temperature-related ice chemistry; neither is presented as a plotted temperature reconstruction.
Worked example: Two fictional decade averages are 12.4°C and 13.1°C. Calculate the change and explain why you should not express it as a percentage of Celsius.
Subtract 12.4 from 13.1 to obtain 0.7°C.
Celsius has an arbitrary zero rather than a zero of thermal energy.
State the temperature difference and the periods compared, instead of a misleading Celsius percentage.
Answer: The difference is 0.7°C; a Celsius percentage is not an appropriate description of warming.
Check your understanding: Does an ice-core bubble directly measure the surface air temperature when it was trapped?
Answer: No; it preserves gas composition. Other properties provide temperature-related proxies.
Why: Different evidence types constrain different variables. A convincing reconstruction combines them with dating and calibration.