What repeated measurements can and cannot tell you
By UK GCSE Chemistry · independent study · myAudience
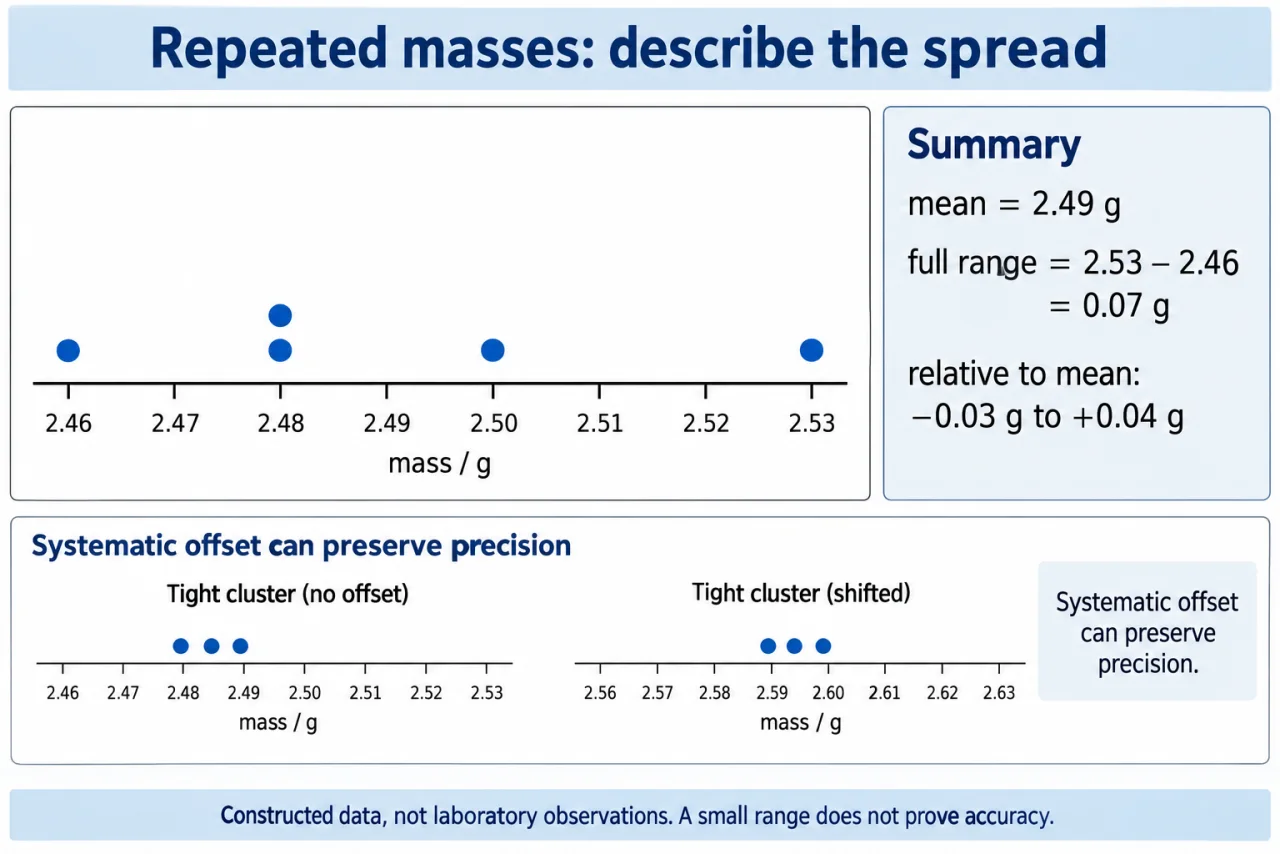
myAudience original generated teaching illustration. Image: illustration, not a documentary photograph. · Original generated teaching illustration; no exam-board or textbook artwork copied.
What repeated measurements can and cannot tell you
Every measured value has uncertainty: a limit on how confidently the value is known. A balance with a small display increment still has calibration and handling limitations. Precision describes how closely repeated readings cluster; accuracy describes closeness to the true value. A tightly clustered set can all be inaccurate if the balance is systematically offset. Repetition is valuable, but it does not turn a display into an exact measurement.
Represent repeated results before reducing them to a single number. A labelled table records each trial and unit. A frequency table or dot plot shows how often values occur and whether the distribution has one cluster or a separated value. For constructed masses 2.46, 2.48, 2.48, 2.50 and 2.53 g, a frequency table has counts 1, 2, 1 and 1 at those four values. The second 2.48 g reading is retained rather than erased as a duplicate.
The arithmetic mean is the sum divided by the number of readings. The range is maximum minus minimum, a simple description of spread. For those masses the mean is 2.49 g and the range is 0.07 g. Relative to the mean, the endpoints lie 0.03 g below and 0.04 g above. If a task explicitly requests a half-range estimate, half the full range is 0.035 g; that convention is not the same as the full range or a statistical confidence interval.
An unusual reading deserves investigation, not automatic deletion. A note that solid was spilled can justify excluding that trial from a mass comparison; merely being far from the preferred answer cannot. State which values were used and why. Repeated readings can reveal random variation, but a common zero error may leave the range nearly unchanged. Check the apparatus and method as well as the scatter when suggesting improvements.
Report units and a sensible number of figures so the conclusion reflects the evidence. Extra calculator digits do not establish extra measurement precision. When comparing changes of similar size to the observed spread, avoid claiming a definite effect from one small difference. A useful explanation identifies the measured quantity, gives the distribution and summary, and states the limitation. This numerical reasoning is an original exercise, not a record of laboratory measurements.
The upper dot plot retains both 2.48 g readings as two stacked dots and has equally spaced 0.01 g increments. Its endpoints are 2.46 and 2.53 g. The lower plots illustrate a shifted cluster with similar spread; they do not themselves establish the true value or a calibration correction.
Worked example: Three constructed product masses are 4.12, 4.16 and 4.14 g. Find the mean, full range and a requested half-range estimate.
Sum = 12.42 g; mean = 12.42/3 = 4.14 g.
Full range = 4.16 − 4.12 = 0.04 g.
Half-range = 0.04/2 = 0.02 g; the estimate may be written 4.14 ± 0.02 g with its convention named.
Answer: Mean 4.14 g; full range 0.04 g; half-range estimate ±0.02 g.
Check your understanding: All repeats cluster closely, but a balance has an uncorrected +0.20 g zero offset. Does the small range prove accuracy?
Answer: No; the readings may be precise but systematically too high.
Why: The common offset shifts the cluster without increasing its spread. Repetition alone does not remove it.