Population change is more than births minus deaths
By UK GCSE Geography · independent study · myAudience
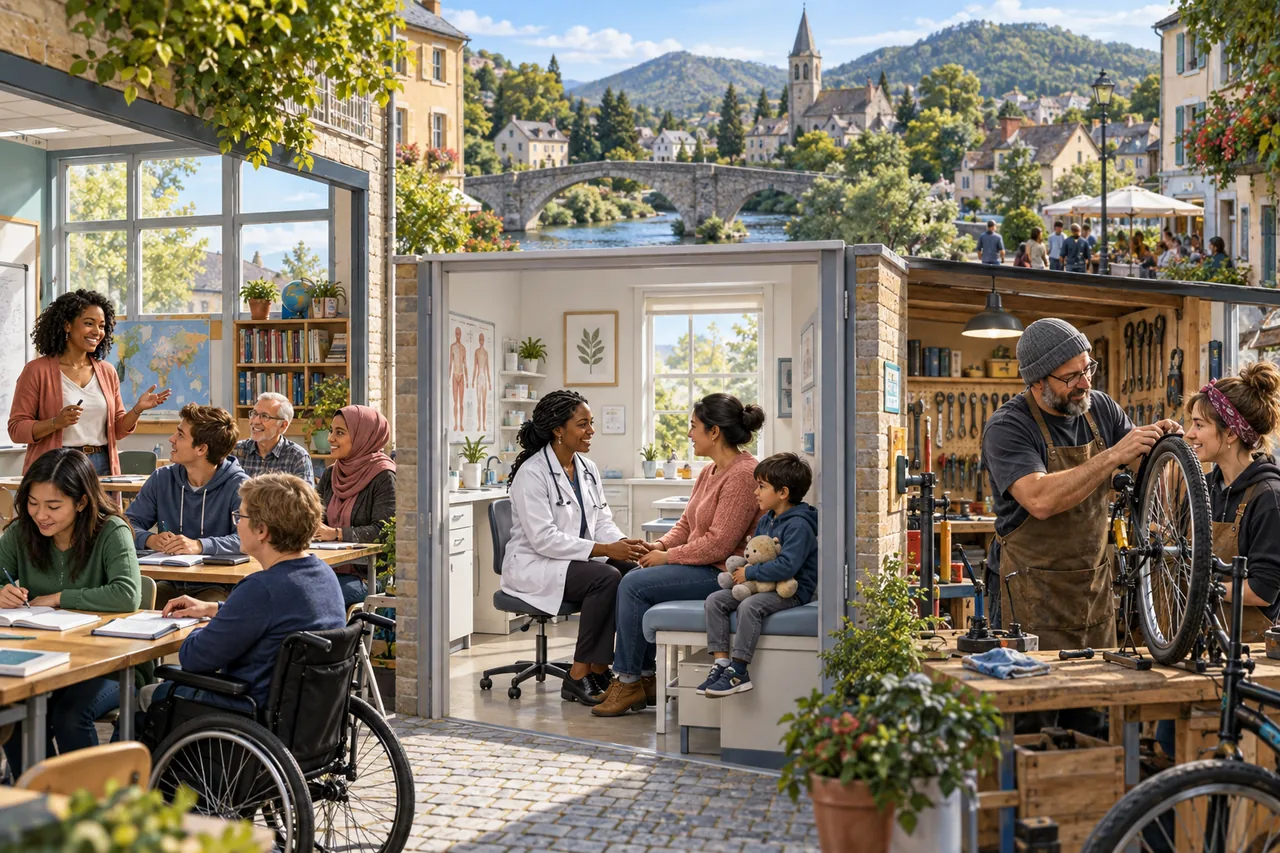
Image: illustration, not a documentary photograph. Original teaching model created for myAudience. · Original generated teaching illustration; no source textbook artwork reproduced.
Population change is more than births minus deaths
A population changes through births, deaths and migration. Natural increase is the excess of births over deaths; natural decrease occurs when deaths exceed births. Net migration is arrivals minus departures. Birth and death rates expressed per thousand people help compare populations of different sizes, but these crude rates also depend on age structure. They are not interchangeable with total fertility rate, which summarises births per woman under specified age-specific fertility conditions.
The demographic transition model is a simplified account of changes from high birth and death rates towards lower rates. Improvements in nutrition, sanitation and healthcare can reduce mortality; changes in education, child survival, economic conditions and reproductive choices can influence fertility. The timing and causes vary. A diagram is a framework for interpreting patterns, not an inevitable timetable or a judgement that one culture is at an inferior stage.
Births may remain numerous after fertility falls because a large cohort reaches childbearing ages: population momentum links today's change to earlier age structure. Conversely, an older population can have a relatively high crude death rate despite good healthcare, because more residents are at ages when death is more likely. To evaluate a health claim, use age-specific or appropriately standardised measures rather than equating every higher crude death rate with worse treatment.
The clinic, school and workplace in the illustration suggest possible connections between health, education and livelihoods. They do not demonstrate a country's transition stage. UN World Population Prospects 2024 separates estimates from projections; future totals depend on assumptions and uncertainty. A projected population is not an observed fact. Use the report's edition and scenario, and explain why a different fertility or migration assumption could change the trajectory.
Apply the model with a population balance and then interpret its limits. Natural decrease does not mean total population must decline if net migration is positive enough. Rapid natural increase may put pressure on services, but consequences depend on planning, resources and employment. A useful explanation connects age structure and flows to particular needs without assuming that population size alone causes poverty or prosperity.
Worked example: A fictional population of 200,000 has annual births of 12 per thousand, deaths of 15 per thousand and net inward migration of 1,000. Estimate its annual change, assuming these rates apply to the stated population.
Births: 200,000 × 12 / 1,000 = 2,400; deaths: 3,000.
Natural change is 2,400 − 3,000 = −600.
Add net migration: −600 + 1,000 = +400, or 0.2% of the starting population.
Answer: Total population grows by approximately 400 despite natural decrease. A precise observed balance would use actual event counts and timing.
Check your understanding: Does a higher crude death rate necessarily show poorer healthcare?
Answer: No; a larger share of older people can raise it.
Why: Compare age structure and age-specific mortality. A crude comparison mixes the age composition with the chance of dying at each age.