Map scale and grid references need a stable frame
By UK GCSE Geography · independent study · myAudience
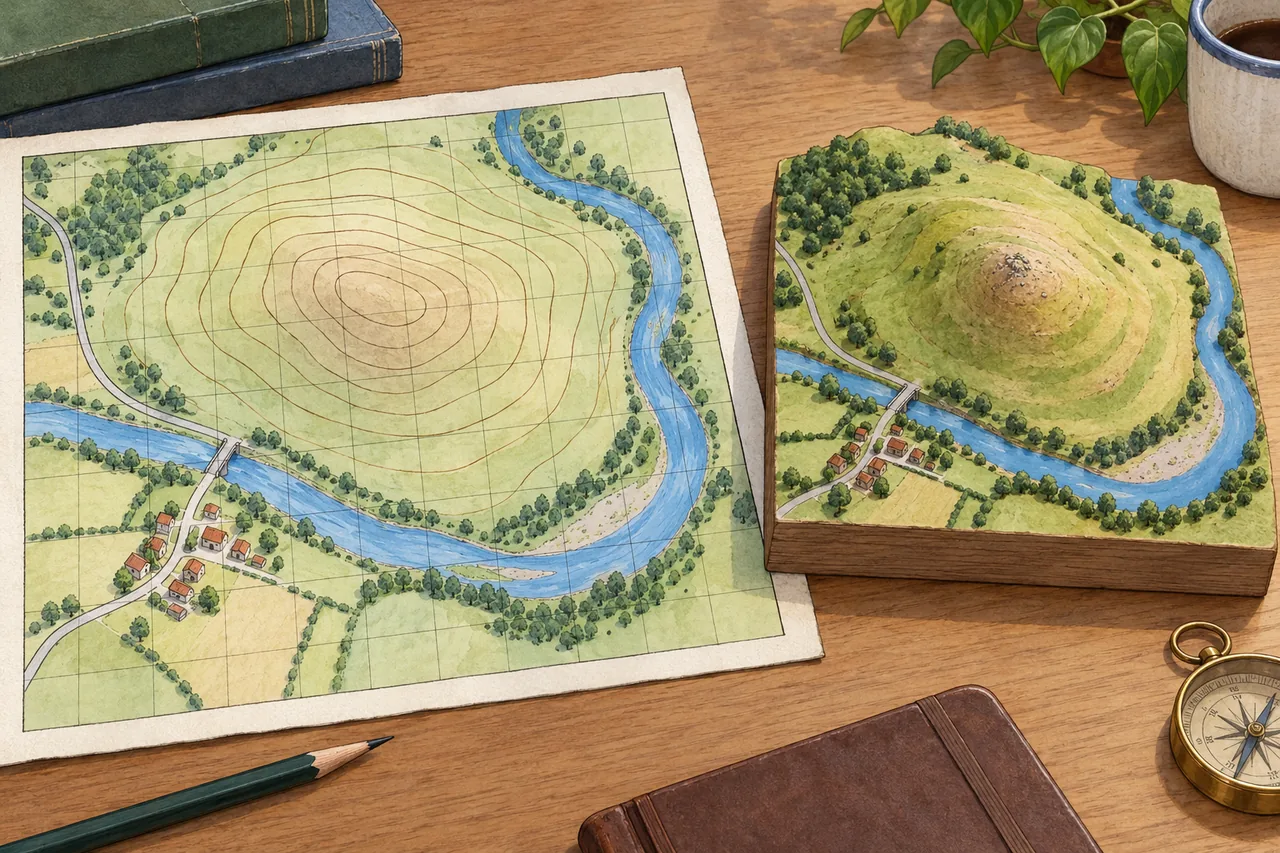
Image: illustration, not a documentary photograph. Original teaching model created for myAudience. · Original generated teaching illustration; no source textbook artwork reproduced.
Map scale and grid references need a stable frame
A map is a selective representation of a place. Scale relates map distance to ground distance, while symbols and a key identify features that cannot be drawn at their real size. A ratio such as 1:25,000 means one unit on the map represents 25,000 of the same units on the ground. Convert units explicitly before applying the result; multiplying centimetres by a ratio does not suddenly produce kilometres.
Printed ratio scales assume the map is displayed at its intended size. Resizing a digital image changes a ruler measurement without changing the printed ratio. A scale bar remains useful when it scales with the map, provided the projection and local context support the intended measurement. The teaching illustration has no calibrated scale, so estimating a real distance from its decorative grid would invent precision.
For an Ordnance Survey grid reference, read eastings before northings: across first, then up. A four-figure reference identifies a kilometre grid square using its lower-left coordinates. Six figures divide each axis within that square into tenths, identifying a 100-metre square on the National Grid rather than an exact point. In a real reference, the appropriate grid letters or geographical context are also needed to avoid ambiguity.
Grid coordinates are not latitude and longitude. Latitude and longitude describe angular position on a reference system; projected grid coordinates express position on a flat mapping system. Direction also needs a reference: map north, grid north and magnetic north may differ. Use the key and map information rather than assuming that every decorative arrow provides a compass bearing or that any square grid is the same national system.
The imaginary map and hill model help connect plan view with landscape form, but their unlabeled contours and grid do not supply surveyed heights or coordinates. For assessed work, use a properly specified map extract and describe the evidence that supports a location or route. Straight-line distance and distance along a winding path answer different questions; explain which one is required before measuring.
Worked example: On an original hypothetical map printed at 1:25,000, a straight route measures 8 cm. A location is 0.5 km east of easting 44 and 0.7 km north of northing 63. Give the distance and six-figure numeric reference.
8 × 25,000 = 200,000 cm = 2,000 m = 2 km, assuming the printed scale is valid.
The containing kilometre square is 4463. The easting tenth is 5; the northing tenth is 7.
Group east then north: 445 637. This locates the 100 m square, not an exact point; add grid letters for a complete National Grid reference.
Answer: The straight distance is 2 km and the numeric reference is 445637. The route along roads could be longer; the imaginary illustration is not the measured map.
Check your understanding: After doubling a map image's displayed width, can you still multiply a ruler measurement by its printed 1:25,000 ratio?
Answer: No; the displayed ratio scale has changed.
Why: The image and its scale bar enlarge together, so use a correctly scaled bar or restore the specified print size.