Reading relief without inventing heights
By UK GCSE Geography · independent study · myAudience
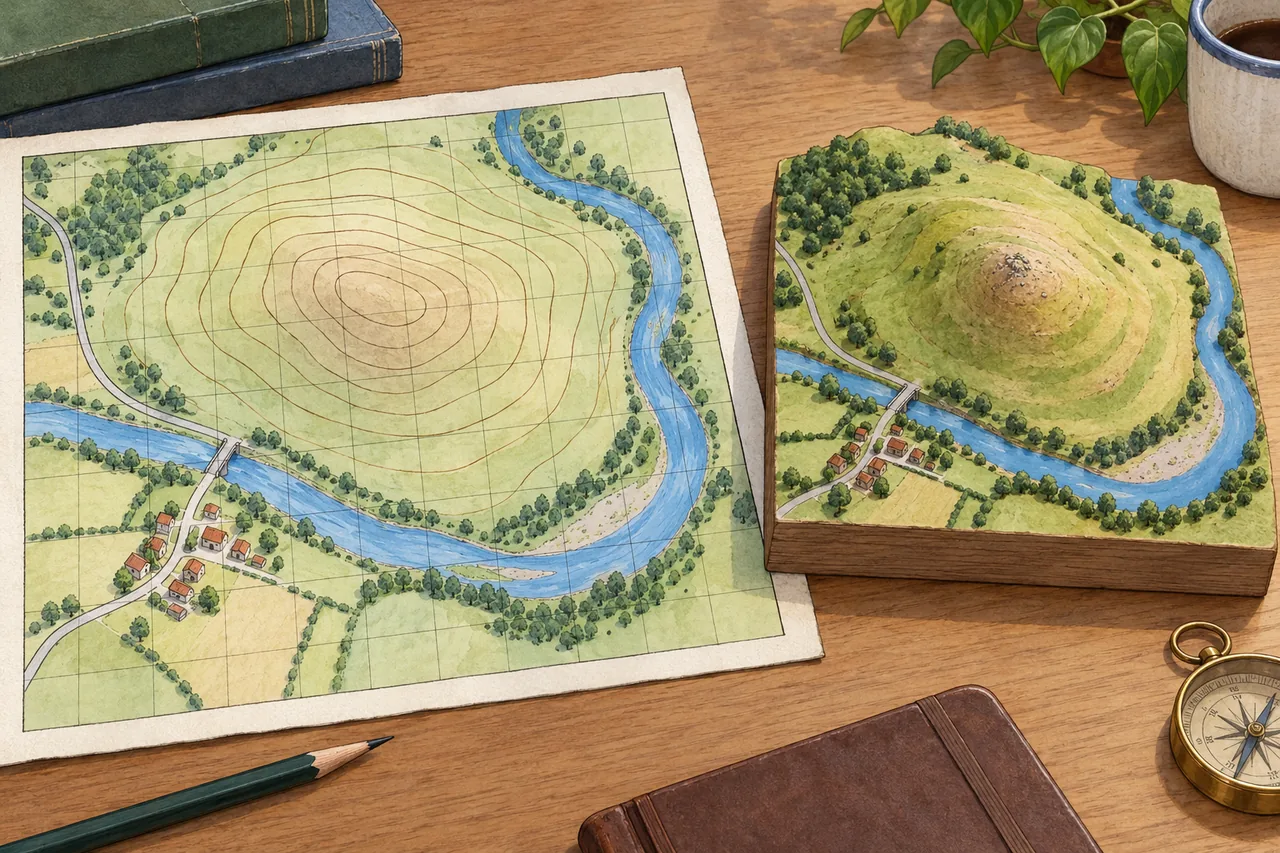
Image: illustration, not a documentary photograph. Original teaching model created for myAudience. · Original generated teaching illustration; no source textbook artwork reproduced.
Reading relief without inventing heights
Contours connect places at the same mapped elevation. To calculate a height difference you need the contour interval and suitable labels or other height information. Close contours indicate a steeper slope than widely spaced contours only when the map scale and contour interval are comparable. Counting unlabeled rings in a decorative drawing does not establish an altitude or a real gradient.
Closed contours often represent a hill, but depressions can also have closed contours, with labels or depression markings distinguishing them. A valley's contours commonly bend towards higher ground where they cross a stream, helping indicate an upstream direction. Interpret several features together: labels, river course, spot heights and the key. One curved line without context does not prove either a ridge or a valley.
The imaginary map sits beside a landscape model to connect a view from above with visible relief. Its height spacing is schematic, not calibrated. Use it to ask where slopes appear steeper and how a route might respond to terrain, while recognising that exact heights and distances require a proper map. A photograph or perspective drawing can clarify form but may distort distance and exaggerate apparent slopes.
Gradient compares vertical change with horizontal distance. Expressing both in the same units is essential. A percentage gradient is vertical rise divided by horizontal run, multiplied by 100; a ratio such as one in ten describes one unit of rise per ten of horizontal run. It is not a percentage of walking distance, and it is not an angle in degrees. Different representations need deliberate conversion.
A route evaluation links relief to purpose. A direct route may be shorter but steeper, while a contour-following route may trade distance for a gentler ascent. Accessibility also depends on surface, obstacles and safety; a low mean gradient can conceal a short steep section. For a justified recommendation, identify the users, inspect local gradient changes and state what a simple overall rise/run calculation misses.
Worked example: A hypothetical path climbs from 100 m to 160 m over 400 m of horizontal run. Calculate its average gradient and assess the claim that it is uniformly 15% throughout.
Rise = 160 − 100 = 60 m. Average gradient = 60 / 400 = 0.15, or 15%.
Horizontal run divided by rise is 400 / 60 ≈ 6.67, so the average ratio is about 1 in 6.67.
The endpoints give no evidence that each segment has the same slope. Some sections may be level and others steeper.
Answer: The average is 15%, about 1 in 6.67. Uniform slope is not established, and a user-specific access judgement needs segment and surface information.
Check your understanding: Two maps show equal spacing between contours. Do they necessarily show equally steep slopes?
Answer: No; scales or contour intervals may differ.
Why: Compare actual ground spacing and elevation change. Similar-looking line spacing can represent different gradients.