Serengeti: following a moving relationship
By Places and their stories · myAudience
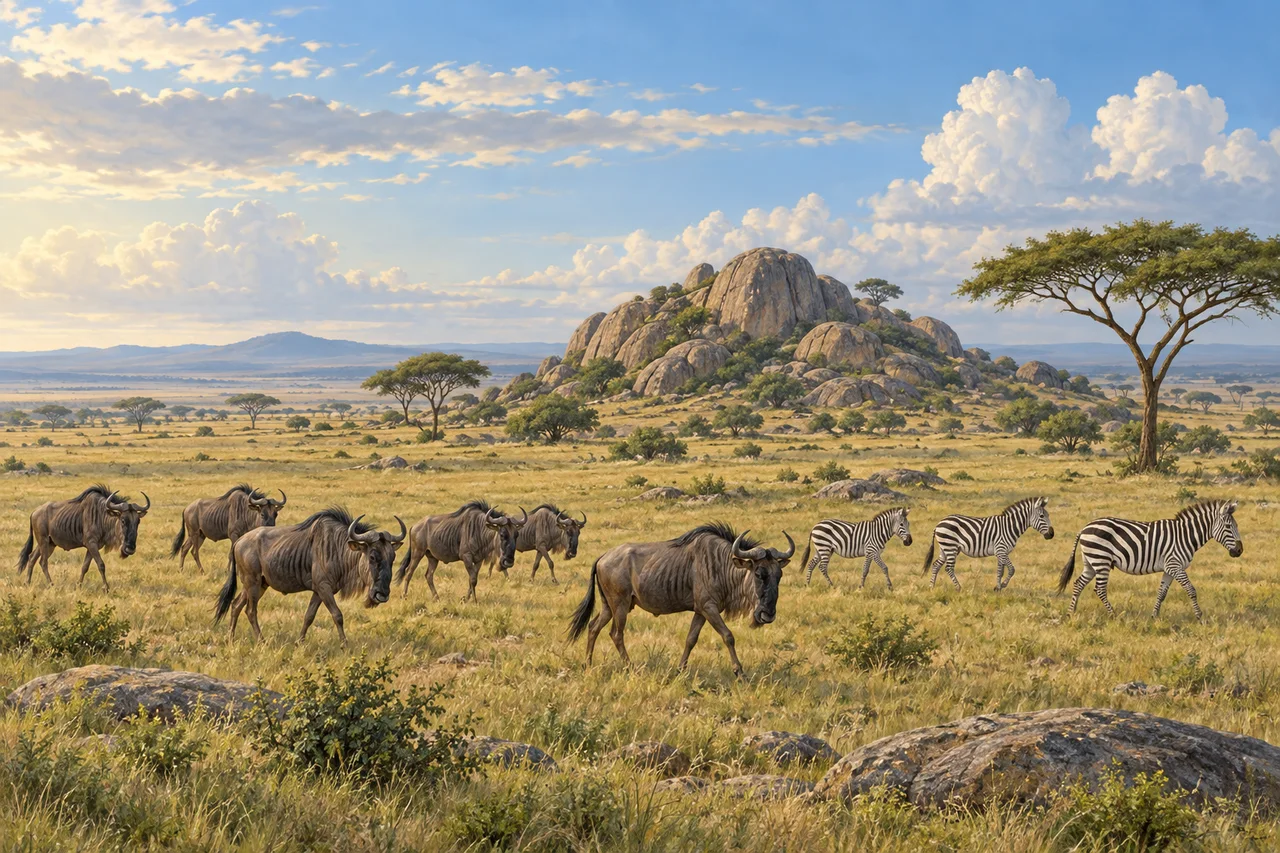
myAudience · original generated illustration · Original generated illustration; interpreted setting, not documentary evidence, current conditions or an authenticated viewpoint.
The Serengeti's open grassland is not an empty stage waiting for animals to arrive. It is part of a changing ecological system in which pasture, water, herbivores and predators interact across a large landscape. A herd in one frame is only a moment in that process. Understanding the movement can be more absorbing than asking a picture to contain every species or the largest possible crowd.
UNESCO describes the movement of wildebeest, zebras and gazelles through the wider Serengeti ecosystem in search of pasture and water. That ecosystem extends beyond the national park, including land in Tanzania and Kenya. A park boundary and an animal's route answer different questions. Conservation has to consider connections between habitats because protecting one patch does not automatically protect all the places animals use during the year.
The heritage account also describes short-grass plains, rocky outcrops called kopjes, rivers and woodlands. These contrasts create opportunities to investigate how landform, soil and water relate to vegetation and animal use. Migration is not a fixed appointment at a particular river on a particular date. A dated observation can describe where animals were seen; a photograph or general account cannot guarantee the same scene for another visitor.
In our interpreted grassland, notice a small group of wildebeest and zebras moving past a low rocky outcrop. Compare the animals' scale with the open horizon. What evidence would distinguish movement through an area from a resident population? Repeated observations would be more useful than counting the invented animals in the picture. The image is not a wildlife census, a route map or a claim that different species always travel together.
Observing wildlife requires distance and respect for park guidance; animals should not be fed or approached to improve a photograph. The landscape also belongs within a wider human and conservation history, rather than being described as a place without people or decisions. This introduction avoids current population totals and promised sightings. It invites further learning about movement, seasonal resources and the challenges of protecting an ecological relationship whose boundaries are larger than a single postcard view.
Image: illustration, not a documentary photograph.
Further reading
The Serengeti's broad grasslands can appear almost empty until movement gives the scene scale. Grazing animals, rocky outcrops and scattered trees occupy a landscape whose resources vary through the year. Migration is part of that changing system, not a parade following a permanently fixed timetable. The illustration gathers a small group of herbivores beside a kopje. It offers a starting point for thinking about forage, water and habitat, while the full ecological story extends far beyond the animals and ground visible in one frame.
UNESCO connects the migration of wildebeest, zebras and gazelles with the search for pasture and water across the wider Serengeti-Mara ecosystem. The national park is therefore part of a larger landscape spanning Tanzania and Kenya. An administrative boundary does not define the complete range of movement or resources. Rainfall, soils, drainage and relief help create contrasts among places, so a single uniform savanna description is insufficient. This is why protecting corridors and considering changes beyond a park boundary can matter to what happens inside it.
Tanzania's park authority distinguishes open grasslands, riverine forests, swamps, woodlands and kopjes, and names the Grumeti River and Seronera Valley among important settings. A kopje is a rocky outcrop rising from the surrounding plain; its different shelter and surface conditions add variety to a broader grassland scene. The existence of several habitats gives animals different resources and constraints. A place useful for shelter may not provide enough forage, while a productive grazing patch may become less useful if water or access changes.
Migration links resource variation across space with an animal's needs across time. New growth and available water can make one region useful when another becomes less favourable. Movement has costs too: energy expenditure, predators, obstacles and the needs of young animals all influence outcomes. This is a general ecological explanation rather than a prediction that a herd will occupy a named place on a particular date. A seasonal map is more informative when it records changing conditions and uncertainty than when it simply draws one immutable arrow around the ecosystem.
Grazing and predators connect the movement to wider food webs. Herbivores consume vegetation and return material through waste; predators use the animals as food. The effects depend on how strongly, where and for how long these interactions occur. A grassland is not explained by a single predator controlling everything beneath it. Nor does counting every animal visible in a crowded scene describe the ecosystem's entire population. Ecologists distinguish local concentration, total abundance and movement, because these quantities can change independently even when a photograph makes them look like one phenomenon.
Consider a fictional herd of two hundred animals spread across twenty square kilometres. Its local density is ten animals per square kilometre. If the same herd concentrates into ten square kilometres, density doubles without any births or arrivals. This small model shows why a more crowded observation need not demonstrate population growth. Real monitoring requires comparable survey areas, detection methods and timing; some animals may be concealed or outside the sampled region. A change in what observers see must be interpreted in relation to how and where they looked.
The illustration shows striped and horned grazing-animal forms near a rocky outcrop, with open grass and scattered trees. It introduces herbivore movement and habitat variety without documenting an actual herd, current season or census. Fine anatomy in a rendering is not reliable evidence for identifying every individual, and the thumbnail is useful mainly for the broad composition. Nothing in the image establishes a crossing date or the condition of a named corridor. Use its movement and setting to ask ecological questions, then seek monitoring and field records for answers.
Check: The fictional two-hundred-animal herd occupies twenty square kilometres one day and ten the next. What happens to density, and does the change prove that the population doubled? Answer: Density rises from ten to twenty animals per square kilometre because the occupied area halves. The total remains two hundred. Concentration, movement between survey areas and detectability can all change counts observed at a place without equivalent changes in population size. These invented figures teach the distinction; they are not Serengeti survey results, a migration forecast or a substitute for consistent monitoring across the wider ecosystem.