This practical study: resistance of a wire
By UK GCSE Physics · independent study · myAudience
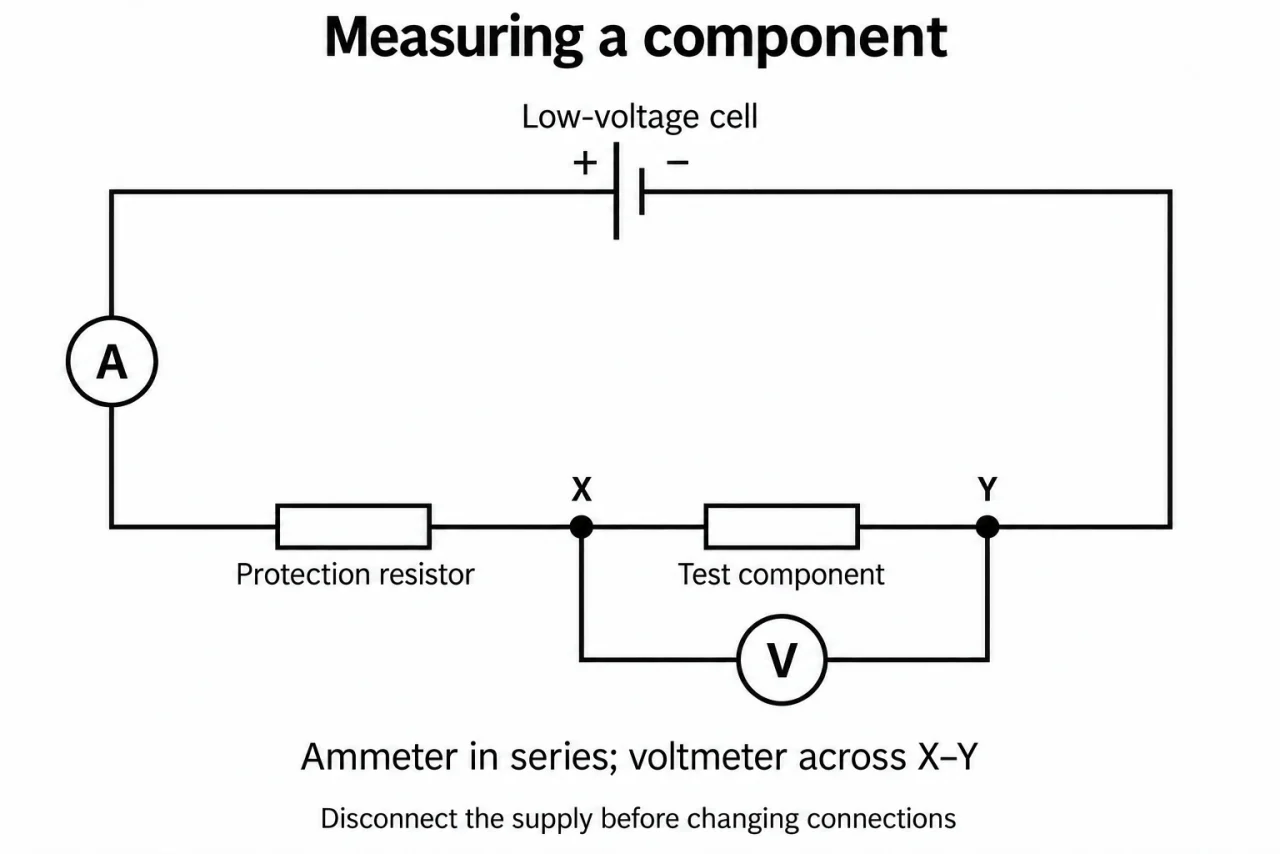
Image: illustration, not a documentary photograph. Original myAudience teaching concept; generated raster independently inspected. · Original generated teaching illustration; source facts attributed in the lesson.
This practical study: resistance of a wire
This practical study investigates wire length at constant temperature as well as resistor combinations. For the wire part, predict that a longer wire of the same material and thickness will have greater resistance. Charge encounters a longer conducting route. This comparison controls material and cross-sectional area; it is not a claim that every long wire has greater resistance than every short one.
A supervised low-voltage circuit uses an ammeter in series with the selected wire length and a voltmeter across that same length. A ruler measures the distance between the electrical contacts. Change the contact separation to change length, recording V and I together, then calculate R = V/I. Use a stable contact position and check zero and instrument ranges. Do not use mains electricity or an unapproved high-current source.
Keep temperature approximately constant by using a small suitable current, taking readings promptly and switching off between measurements to allow cooling. Heating the wire changes its resistance and confounds a length comparison. Handle apparatus as instructed because even low-voltage circuits can heat wires. Keep the same wire material and diameter and avoid stretching it; changing thickness introduces another variable.
Use several lengths, repeat measurements and examine an R-against-length graph. Put length in metres on the horizontal axis and resistance in ohms on the vertical axis. A straight trend supports proportionality only if an intercept near zero is also consistent with uncertainty. Contact or lead resistance can produce an offset; repeats reveal scatter but do not automatically remove that offset. All values in the example are invented teaching data, not results from a completed practical.
For the wire investigation, use plate 06’s test-component position for the selected length between X and Y. The voltmeter must span those contacts; including the protection resistor would measure the wrong potential difference. The ammeter belongs in the main route. Changing the supply setting must not replace measuring V across the wire. The circuit alone does not establish constant temperature: use a suitable low current, switch off between readings, allow cooling and keep the same material and thickness. Resistance inferred from V/I includes whatever lies between the voltage contacts.
Vocabulary: independent variable = quantity deliberately changed; control variable = quantity kept comparable; intercept = graph value at zero horizontal coordinate; uncertainty = limitation on a measurement.
Worked example: Illustrative readings are 0.80 V and 0.20 A for 0.40 m of wire, then 1.60 V and 0.20 A for 0.80 m at the same temperature. Calculate both resistances and the gradient of the R–length line between them.
R1 = 0.80/0.20 = 4.0 Ω; R2 = 1.60/0.20 = 8.0 Ω.
Gradient = change in R/change in length = (8.0 − 4.0)/(0.80 − 0.40).
Gradient = 10 Ω/m. Doubling length has doubled resistance in these data.
Answer: 4.0 Ω and 8.0 Ω; gradient 10 Ω/m.
Check your understanding: For 0.60 m of the same wire, readings are 1.26 V and 0.21 A. What resistance is obtained, and why must temperature still be controlled?
Answer: 6.0 Ω; warming can change resistance independently of length.
Why: 1.26/0.21 = 6.0 Ω. A neat proportional result cannot establish that a real experiment controlled every relevant variable.