Why I–V graphs have different shapes
By UK GCSE Physics · independent study · myAudience
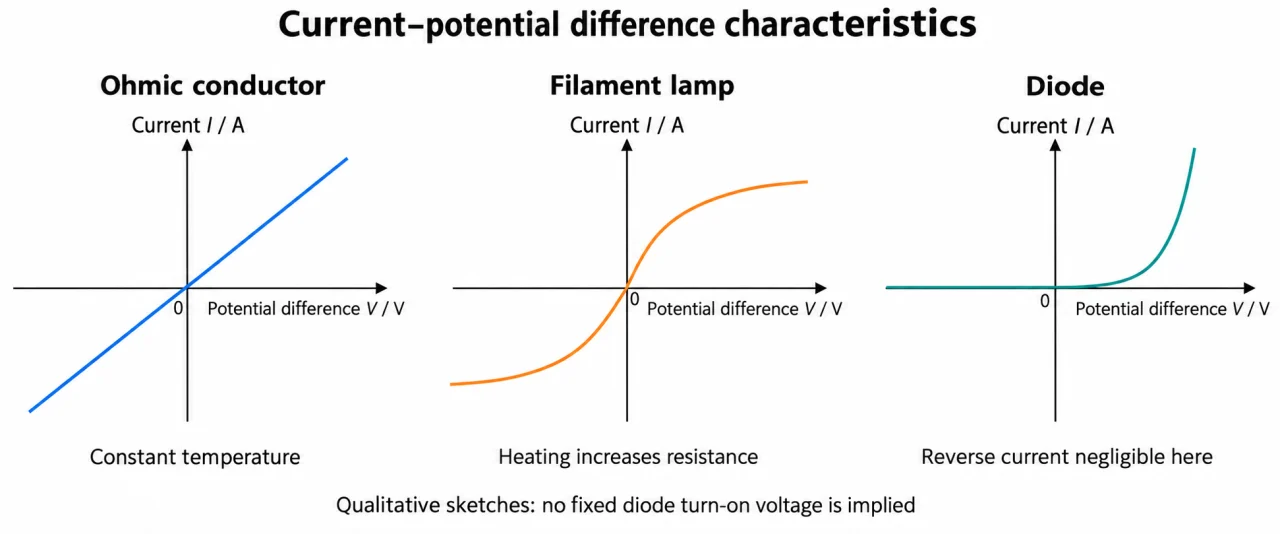
Image: illustration, not a documentary photograph. Original myAudience teaching concept; generated raster independently inspected. · Original generated teaching illustration; source facts attributed in the lesson.
Why I–V graphs have different shapes
An I–V graph places potential difference on the horizontal axis and current on the vertical axis. For an ohmic resistor held at constant temperature, the points form a straight line through the origin. Current is directly proportional to potential difference. On this choice of axes, gradient is I/V, the reciprocal of resistance: a steeper straight line represents a lower resistance.
A filament lamp behaves differently. Increasing potential difference increases current and heats the filament. Its resistance rises as the temperature rises, so each further increase in potential difference produces a smaller increase in current. The I–V curve becomes less steep at larger magnitudes. Reversing the potential difference reverses the current; an ordinary filament lamp has a similar curve shape in both polarities.
A diode strongly favours one current direction. In the forward direction, little current flows until the potential difference reaches a region where current rises rapidly. In reverse, the current is very small in the operating range studied. The GCSE “one direction” model is a useful approximation, not a claim that reverse breakdown can never occur. A protection resistor limits current in a diode investigation.
For a curved graph, calculate the resistance at a point using that point’s V/I. Do not use the tangent gradient as ordinary resistance: its reciprocal describes a small-change response, which is a different quantity. Always name the axes and units. A line that is straight but misses the origin is not evidence of direct proportionality, and a graph taken while temperature changes does not test the constant-temperature ohmic condition.
To estimate the rate at which current changes with potential difference at one point of a smooth curve, draw a straight tangent that follows the curve’s local direction. Choose two well-separated points on that tangent, not two arbitrary points on the curve, and divide the change in current by the change in potential difference. For example, a supplied tangent passing through (2.5 V, 0.30 A) and (3.5 V, 0.34 A) has slope (0.34 − 0.30)/(3.5 − 2.5) = 0.040 A/V. This says how rapidly current changes locally; it is not the resistance V/I at either curve point.
Read plate 04 with I vertically and V horizontally, including negative values. The ohmic line goes through zero with constant slope; its temperature condition is essential. The filament curve becomes shallower away from zero in both polarities, consistent with heating. The diode’s reverse trace lies on the axis at this drawing’s resolution, while its forward trace rises rapidly. There are no numerical scales: compare shapes, not absolute resistances between panels, a fixed turn-on voltage, or an exact zero leakage. A different choice of axes would change what gradient means.
Vocabulary: ohmic = constant resistance under stated conditions; direct proportionality = constant ratio and zero origin; forward direction = diode’s conducting orientation; non-linear = not a straight-line relationship.
Worked example: An invented lamp graph has points (2.0 V, 0.25 A) and (6.0 V, 0.50 A). Calculate resistance at each point and compare.
At the first point, R = 2.0/0.25 = 8.0 Ω.
At the second, R = 6.0/0.50 = 12 Ω.
Current has doubled while potential difference has tripled; resistance is not constant.
Answer: 8.0 Ω then 12 Ω; the hotter operating point has greater resistance.
Check your understanding: A straight I–V line through the origin has gradient 0.050 A/V. What is its resistance?
Answer: 20 Ω.
Why: R = V/I = 1/(I/V) = 1/0.050. On an I–V graph the gradient itself is not resistance.