This practical study: collecting I–V evidence
By UK GCSE Physics · independent study · myAudience
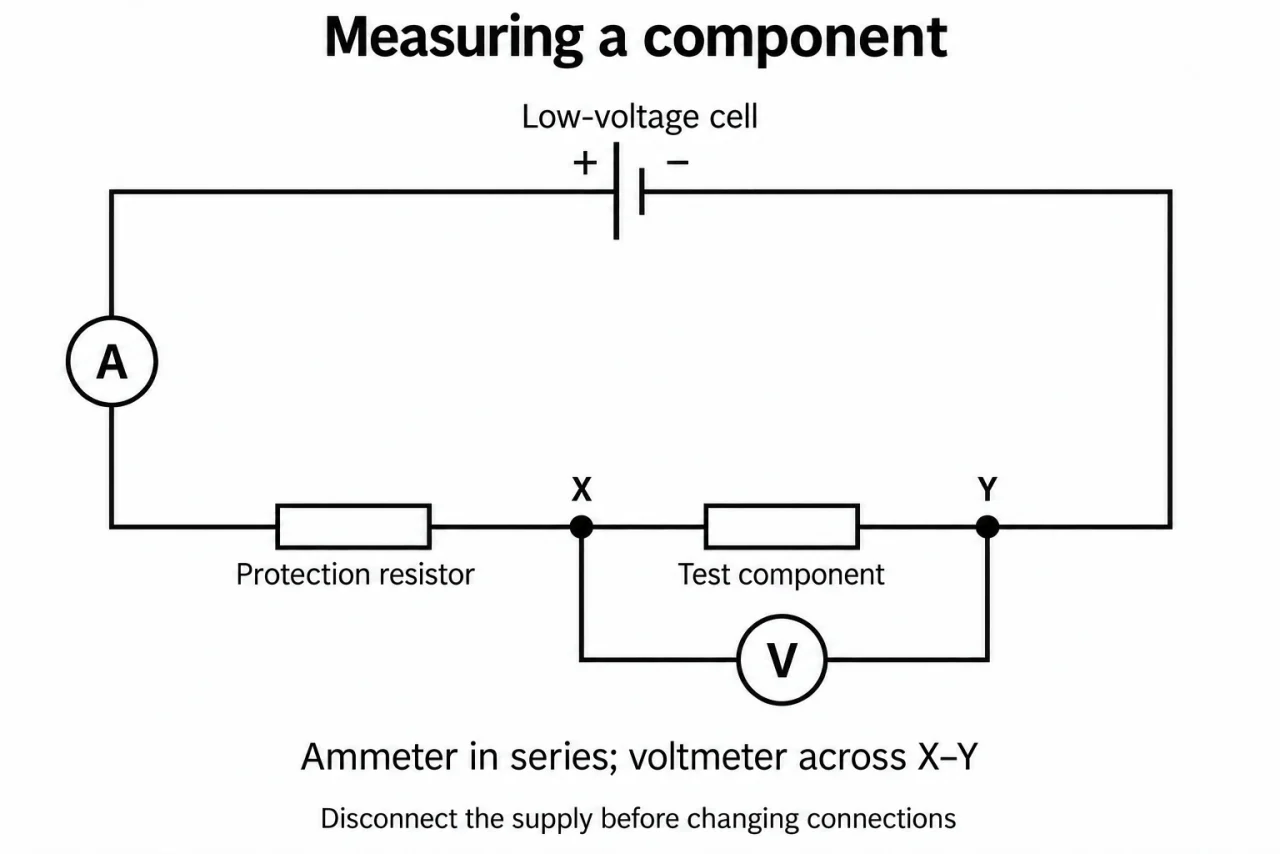
Image: illustration, not a documentary photograph. Original myAudience teaching concept; generated raster independently inspected. · Original generated teaching illustration; source facts attributed in the lesson.
This practical study: collecting I–V evidence
This practical study investigates a resistor at constant temperature, a filament lamp and a diode. Before assembling each circuit, draw a supply, ammeter and tested component in series and a voltmeter across the tested component. Include a suitable means of changing potential difference and current-limiting protection where needed. This diagram is a measurement plan: it shows exactly which current and potential difference form a paired reading.
Under teacher supervision, use a suitable low-voltage supply and begin with a small setting. Record several paired readings over an approved range, changing only the intended setting. To obtain negative values, isolate the supply and reverse its polarity as instructed, then reconnect and record signed readings. Never rewire a live circuit, exceed component ratings or treat a diode as an unrestricted short circuit in its conducting direction.
For the fixed resistor, reduce heating so temperature stays approximately constant. For the filament lamp, the changing filament temperature is the physical reason for its changing resistance; allow each reading to settle. For the diode, keep a protective series resistor and respect its current limits. A very small reverse current may be below instrument resolution: “no measurable current” is more honest than claiming exact zero from a meter display.
Plot current in A vertically against potential difference in V horizontally, include negative and positive regions where collected, and choose scales that use the graph area well. Draw a justified line or smooth curve rather than forcing every point into a straight line. Repeated readings can identify scatter or a suspicious outlier; investigate its cause before excluding it. Compare shapes with component properties, and distinguish heating drift from random variation. These are original illustrative values; laboratory completion needs observed practical work.
Trace plate 06: the positive supply connection leads through the circular A meter, the protection resistor, node X, the test component and node Y back to the negative connection. The circular V meter has a separate branch from X to Y, across only the test component. The two filled dots are real joins. The cell symbol represents a low-voltage cell for one operating reading. For an I–V sweep, use a suitable adjustable dc source or an appropriately drawn variable-resistor control with approved ratings; the fixed protection resistor is not an adjustment control. In the ideal-meter approximation V draws negligible current, so A measures test current; real voltmeter loading is a limit, not an excuse to put A across the supply.
Check the apparatus by temporarily replacing a nonlinear test component with a known fixed resistor and comparing paired V/I values across an approved range. A systematic shift in all readings suggests checking zero or range; increasing R during the sweep suggests heating or another condition change. These hypotheses need tests, not deletion of inconvenient values.
Vocabulary: paired reading = V and I measured at the same condition; polarity = orientation of supply terminals; resolution = smallest displayed change; outlier = result unusually far from the pattern.
Worked example: Three invented repeats at 2.0 V for a resistor give currents 0.098 A, 0.100 A and 0.102 A. Find the mean current and resistance calculated from the mean.
Mean I = (0.098 + 0.100 + 0.102)/3 = 0.100 A.
R = 2.0/0.100 = 20 Ω.
The spread of readings matters; the mean does not prove the absence of heating or a calibration error.
Answer: Mean 0.100 A; resistance 20 Ω.
Check your understanding: A nominal 20 Ω resistor gives 2.0 V/0.100 A initially and 2.0 V/0.090 A after the sweep. What resistances are inferred? Can these readings identify random error or establish constant temperature?
Answer: 20 Ω and approximately 22.2 Ω. They do not establish constant temperature or uniquely identify the cause.
Why: At the same voltage the lower later current implies a larger V/I ratio. Repeat under controlled cooling, inspect contacts and instrument zero; two readings cannot distinguish scatter from systematic drift.