Testing a resistance claim with uncertainty and an intercept
By UK GCSE Physics · independent study · myAudience
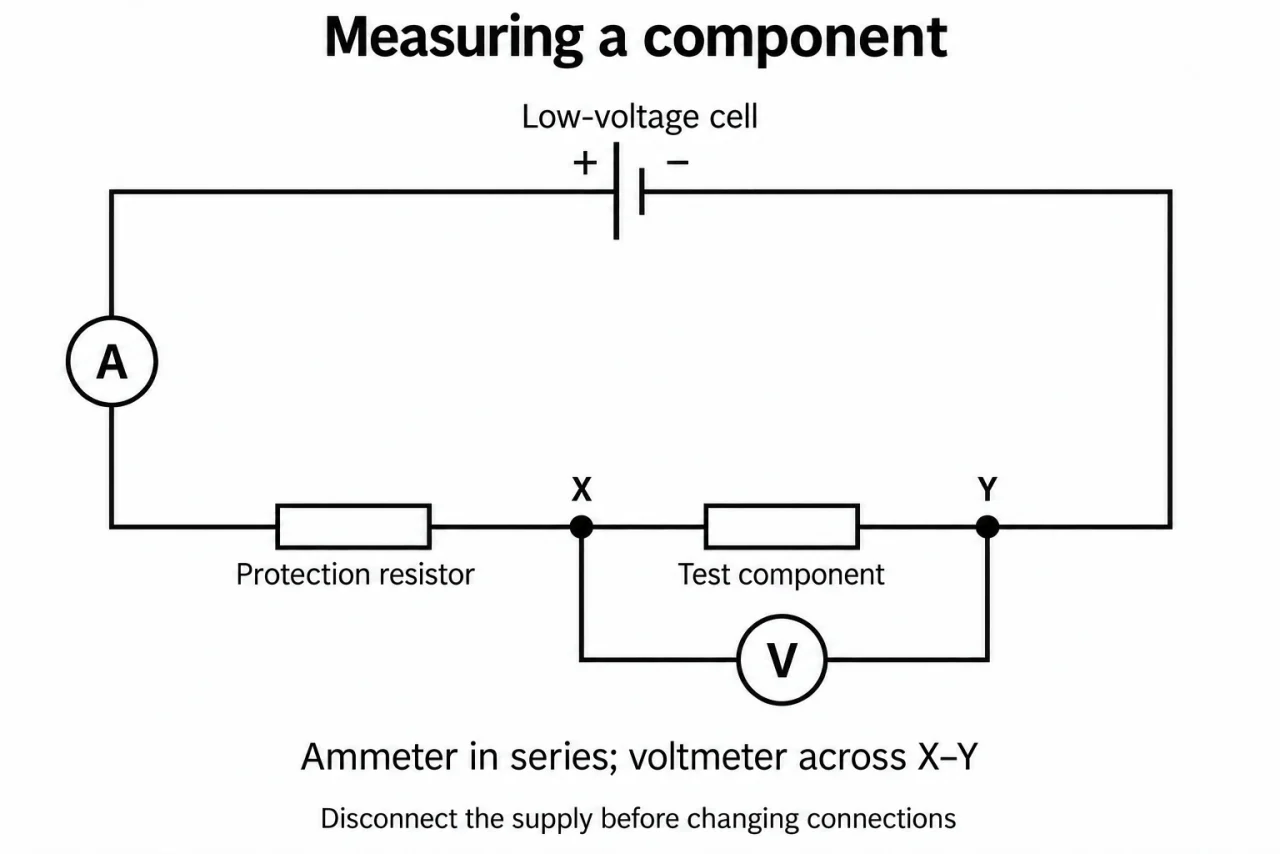
Image: illustration, not a documentary photograph. Original myAudience teaching concept; generated raster independently inspected. · Original generated teaching illustration; source facts attributed in the lesson.
Testing a resistance claim with uncertainty and an intercept
A reproducible result can still be biased. Repeats estimate scatter; an instrument zero offset or a consistent extra contact resistance can shift every reading together. Resolution is the smallest displayed increment, while accuracy concerns closeness to the true value. Never treat a displayed last digit as a guaranteed uncertainty. In this lesson each stated ± bound is supplied as a conservative limit for the exercise, not inferred from a meter’s resolution or claimed as a confidence interval.
Plate 06 shows why the voltage contacts define the measured object. For a wire-length comparison, keep wire material, diameter and temperature comparable, measure between the same kinds of contacts, and record paired V and I. Repeat at several spaced lengths and recheck a short length after the longer ones: increasing resistance on return can reveal heating drift. Report anomalous values, investigate loose contacts or range changes, and repeat; do not delete an awkward result just to obtain a straight line.
Calculate a mean and describe the spread with its units. A half-range is a simple description of observed scatter for these exercises, not a universal error formula. More repeats can improve a mean’s stability against random variation, but cannot remove a systematic offset. If the question supplies bounds for V and I, the largest possible V/I uses the largest V and smallest positive I; the smallest uses the reverse combination. This direct endpoint method avoids an unearned claim about statistical uncertainty propagation.
For an R-against-length plot, label length in metres horizontally and resistance in ohms vertically; include the measured range and supplied uncertainty bars. Draw a justified best-fit line rather than forcing the origin. A non-zero intercept may indicate added contact or lead resistance. A linear trend is not direct proportionality unless zero intercept is consistent with the evidence. Extrapolating to zero length tests a model beyond measured lengths: it cannot identify the unique cause of an offset.
Use the invented exact trend R = 10L + 0.50, where L is the numerical length in metres and R the numerical resistance in ohms: 0.20, 0.40, 0.60, 0.80 m give 2.50, 4.50, 6.50, 8.50 Ω. Gradient is 10 Ω/m and intercept 0.50 Ω. Doubling 0.20 to 0.40 m does not double the total measured resistance. The proportional wire contribution is plausible after allowing for an offset, but uncertain slopes/intercepts and temperature control still need evaluation.
Vocabulary: systematic offset = repeated shift in one direction; half-range = half of maximum minus minimum; bound = supplied limiting value; best fit = trend balancing the data; extrapolation = prediction outside observed range.
Worked example: At one wire length, illustrative paired readings have current 0.200 A and voltage repeats 0.98, 1.00, 1.02 V. Find mean resistance and voltage half-range. For a later independent reading use V = 1.00 ± 0.02 V and I = 0.200 ± 0.005 A as supplied bounds. Is a claimed 5.20 Ω resistance excluded?
Mean V = 1.00 V; half-range = (1.02 − 0.98)/2 = 0.02 V. With the identical currents in these repeats, mean R = 1.00/0.200 = 5.00 Ω.
Endpoint minimum R = 0.98/0.205 = 4.78048… Ω; endpoint maximum R = 1.02/0.195 = 5.23077… Ω. To quote a conservative interval at two decimals, round outwards to 4.78–5.24 Ω, not inwards to 5.23 Ω.
5.20 Ω lies inside those supplied bounds, so these data do not exclude it. This is consistency within assumed limits, not proof that 5.20 Ω is the true resistance.
The mean reduces sensitivity to scatter. It cannot remove a voltmeter offset or extra contact resistance; investigate those independently.
Answer: Mean R = 5.00 Ω; voltage half-range 0.02 V; bounded R 4.78048…–5.23077… Ω, or a conservative rounded interval 4.78–5.24 Ω. The 5.20 Ω claim is not excluded.
Check your understanding: A fitted R–length line passes through (0.20 m, 2.50 Ω) and (0.80 m, 8.50 Ω). What are gradient and intercept? Does that establish R proportional to length or prove contact resistance is the cause?
Answer: 10 Ω/m; 0.50 Ω; neither direct proportionality of the total measured R nor a unique contact-resistance diagnosis is established.
Why: Gradient = 6.00/0.60 = 10 Ω/m; intercept = 2.50 − 10 × 0.20 = 0.50 Ω. The line misses zero. An offset is compatible with contacts but alternative systematic effects need checking, and fit uncertainty was not supplied.