Direct and alternating supplies
By UK GCSE Physics · independent study · myAudience
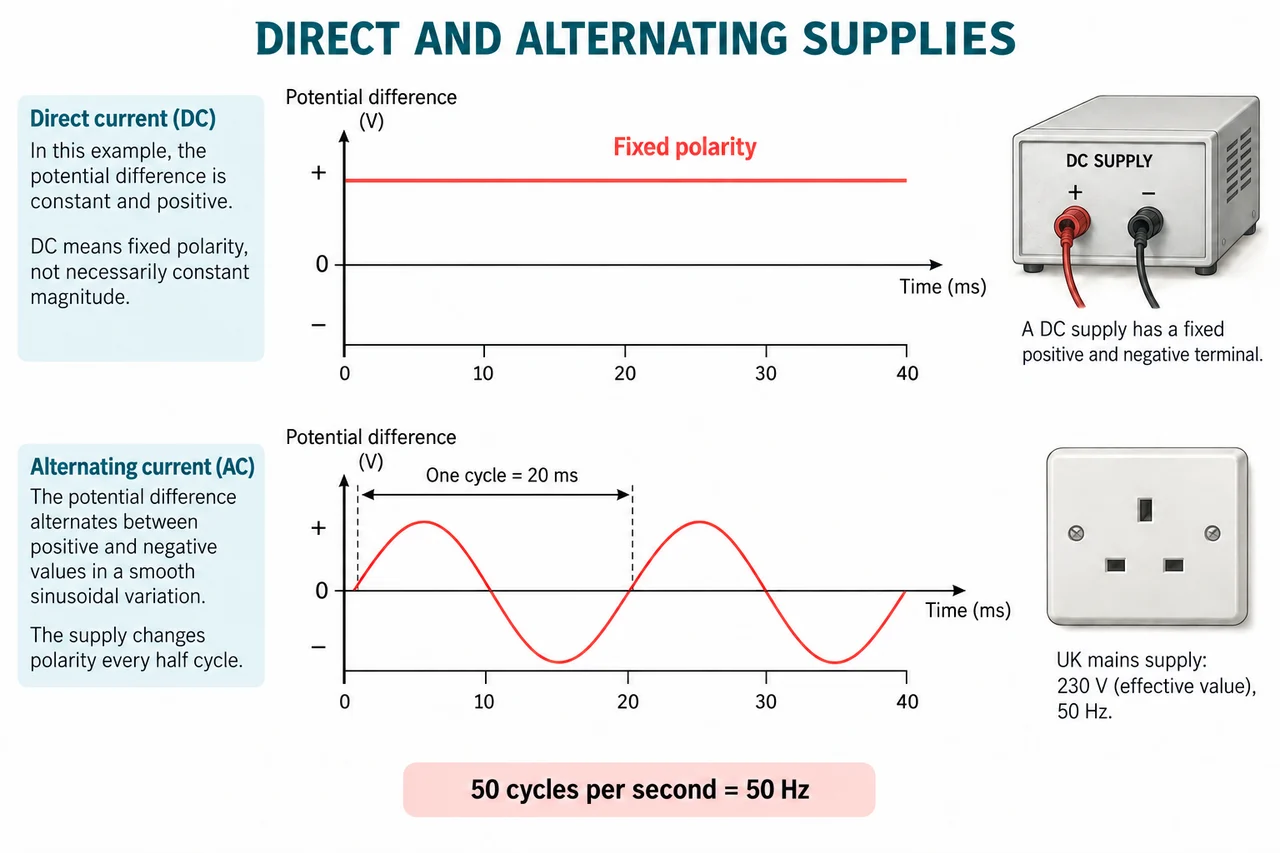
Image: illustration, not a documentary photograph. Original generated teaching illustration for myAudience. · Original AI-generated illustration; editorial scientific review required before publication.
Direct and alternating supplies
A direct potential difference maintains one polarity. A cell is a familiar example: in a simple external circuit, conventional current travels in one direction. Direct does not necessarily mean its magnitude can never change; it means the supply does not repeatedly reverse polarity. A declining battery potential difference is still direct.
An alternating potential difference repeatedly reverses polarity, so current in a resistive circuit reverses direction as well. In a potential-difference-against-time graph, an alternating waveform moves above and below zero. A complete cycle returns to the same stage of the repeating pattern. Frequency is the number of complete cycles each second, measured in hertz, Hz.
The UK domestic mains supply is about 230 V and 50 Hz. Fifty hertz means fifty complete cycles per second, not fifty electrons per second. During one sinusoidal cycle there are two changes between positive and negative polarity. The quoted 230 V is an effective, or rms, value rather than the peak of the wave; calculating that peak is outside this lesson’s required scope.
Compare supply graphs using labelled axes and a zero line. A constant positive horizontal line represents a steady direct potential difference; a curve repeatedly crossing zero represents an alternating one. Raising frequency compresses cycles into less time and is different from increasing their amplitude. Use supplied or simulated graphs for this lesson: students must not connect ordinary classroom meters or equipment to mains to investigate its waveform.
Vocabulary: direct = fixed polarity; alternating = repeatedly reversing polarity; frequency = cycles per second; cycle = complete repeat; rms = effective ac value used for the quoted mains voltage.
Read the horizontal axis before counting cycles. A pattern that repeats twice across a 40 ms interval has a period of 20 ms and frequency 50 Hz. A negative value means reversed polarity relative to the chosen terminals, not negative energy or a faulty supply. If both terminal labels were swapped, the graph would invert vertically but its period would remain unchanged. This separates a choice of sign convention from a physical repetition rate.
Original transfer challenge: a recorded waveform has successive upward zero crossings at 8 ms and 33 ms, a peak of 4 V and a trough of −4 V. A second trace has the same crossing times but twice the peak magnitude. Explain what changed. The period is 25 ms = 0.025 s, so both have frequency 40 Hz. Only amplitude changed; the polarity still reverses and the supplies remain alternating. Using 33 ms alone would wrongly treat the instrument’s arbitrary time origin as a complete cycle.
A graph is evidence about the quantity actually recorded. A voltage graph alone does not determine the current through an unknown appliance: its resistance or more detailed behaviour is also needed. A sinusoidal supply through a fixed resistor produces a corresponding reversing current; a device containing electronics need not have that same current shape. Do not promote the simple resistor model into a claim about every household appliance. The illustrated waveform is a teaching model with uncalibrated amplitude, not a measurement of a mains socket.
Worked example: An illustrative alternating supply completes 125 cycles in 2.5 s. Find its frequency and the duration of one cycle.
Frequency = 125/2.5 = 50 Hz.
One cycle lasts 1/50 s.
1/50 = 0.020 s = 20 ms.
Answer: 50 Hz; cycle duration 0.020 s.
Check your understanding: A graph crosses zero between positive and negative regions 100 times in a second. If there are two such crossings per cycle, what is its frequency?
Answer: 50 Hz.
Why: 100 crossings divided by two crossings per cycle gives 50 complete cycles; crossing count is not automatically frequency.