practical study: compare temperature changes without confusing variables
By UK GCSE Chemistry · independent study · myAudience
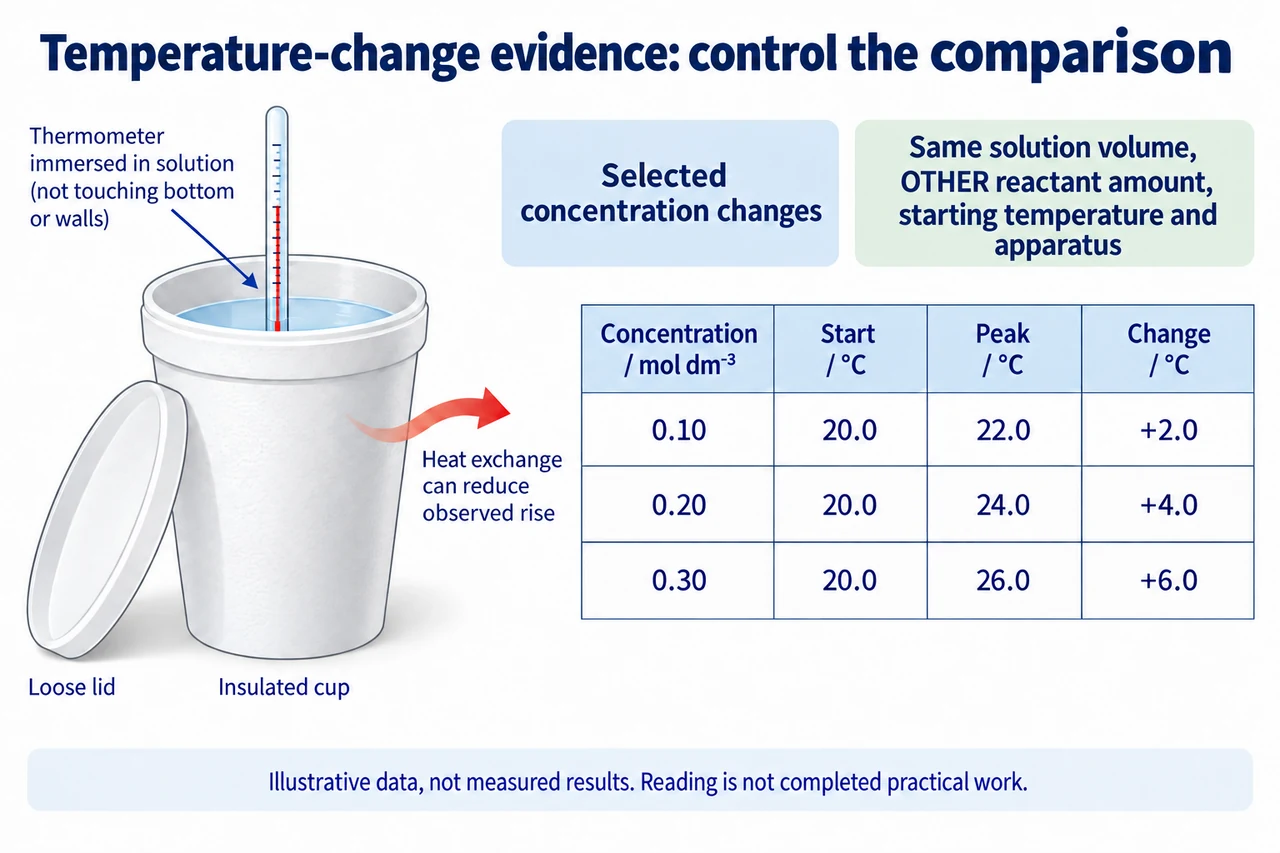
Image: illustration, not a documentary photograph. Original teaching model created for myAudience. · Original generated teaching raster; no exam-board or textbook artwork copied.
practical study: compare temperature changes without confusing variables
A temperature investigation asks which selected variable changes the observed temperature response. Start with a testable hypothesis rather than a list of apparatus: for a chosen exothermic solution reaction, increasing the concentration of one reactant at fixed solution volume may increase the temperature rise while the other reactant remains in excess. That is a conditional prediction. If the other reactant becomes limiting, or heat exchange differs, a proportional pattern may stop. This practical study is about investigating such variables; written plans and fictional results do not demonstrate completed practical competence.
The independent variable is the selected concentration; the dependent measurement is a temperature change determined from starting and peak readings. Keep solution volume, the amount of the other reactant, initial temperature and apparatus comparable. At fixed volume, changing concentration changes the amount of the selected solute, so it is contradictory to say that both reactant amounts remain fixed. Identify which quantity is deliberately changed and which is controlled. In a different investigation, reactant identity or solution volume could be the independent variable, but changing several together defeats a simple causal comparison.
Read the corrected plate carefully: 0.10, 0.20 and 0.30 mol dm−3 are chosen concentrations, each with a 20.0 °C start; peaks of 22.0, 24.0 and 26.0 °C give rises of 2.0, 4.0 and 6.0 °C. The concentration is not itself the temperature change. A plot should put concentration on the horizontal axis and temperature change on the vertical axis, with both units stated. These three fictional points form a linear pattern over their displayed range; they do not establish a universal law or a value outside that range.
The probe should sense the solution rather than the cup wall or base. An insulated cup limits heat exchange but does not abolish it. Comparable gentle mixing and consistent observation help avoid sampling different temperatures within a mixture. A loose protective lid can reduce exchange in a teacher-approved investigation without being mistaken for a sealed gas-generating system. The drawing is an apparatus concept, not a chemical recipe: reagent selection, concentrations, quantities, PPE, handling and disposal require the school’s risk assessment and supervision.
For an exothermic mixture, heat lost before a reading tends to reduce the observed rise; for an endothermic mixture, energy entering from the room can reduce the observed fall. The effect can vary with duration and temperature difference. Insulation and consistent timing target those mechanisms. A thermometer’s finite resolution introduces reading uncertainty, but repetition does not repair a consistent heat-loss bias. Avoid the vague improvement “use better equipment” without explaining what error it addresses and which conclusion becomes more trustworthy.
Use repeats to judge scatter. Suppose the chosen 0.20 mol dm−3 condition gives rises 3.8, 4.0 and 4.2 °C: the arithmetic mean is 4.0 °C and the range is 0.4 °C. A fourth value of 6.4 °C requires an investigation of the record, mixing, starting conditions or transcription; it should not be removed solely because it spoils the hypothesis. Report the reason for any exclusion, retain the original data and consider a repeat. A mean from three readings is not a guarantee of accuracy or a statistical confidence interval.
Transfer challenge: a group doubles concentration but also doubles solution volume, uses a metal beaker instead of the insulated cup and waits longer before reading. It obtains a larger temperature rise and concludes concentration alone caused the difference. Identify three distinct confounders, redesign the comparison without specifying a dangerous procedure, and explain why measuring a complete temperature–time record can be more informative than a single delayed value. What evidence would be needed before extending the conclusion to an untested concentration?
Reasoned answer: solution amount changes the thermal response, the container changes energy exchange, and the delay can miss different extrema. Keep those conditions matched while changing only the selected concentration, and preserve the other reactant’s chosen amount. A temperature–time record identifies the extremum and subsequent drift, supporting a consistent comparison. Extending the trend needs additional controlled results and a check that the other reactant remains in excess. Author assessment criteria require a causal explanation for each improvement, explicit variables and a cautious inference; actual safe handling, accurate observation and recorded experimental work remain external requirements.
Worked example: Fictional rises for one concentration are 3.8, 4.0 and 4.2 °C. Find the mean and range. A neighbouring concentration gives 4.1, 4.2 and 4.3 °C; explain the strength and limitation of a claim that it gives a larger response.
Mean of first set: (3.8 + 4.0 + 4.2)/3 = 4.0 °C; range = 4.2 − 3.8 = 0.4 °C.
Mean of second set is 4.2 °C; its range is 0.2 °C. The observed mean difference is 0.2 °C.
The sets overlap. More controlled evidence and measurement uncertainty are needed for a confident difference; do not treat ranges as a formal significance test.
Answer: The second observed mean is larger by 0.2 °C, but overlap and systematic effects limit the inference.
Check your understanding: Why does fixed volume not mean a fixed amount of selected reactant when its concentration changes?
Answer: Concentration expresses amount per volume. At the same volume, a higher concentration supplies more of that solute.
Why: The practical control statement must distinguish the deliberately varied solute from the other reactant. Keeping both amounts fixed would contradict this design.