Read the barrier, not just the finish
By UK GCSE Chemistry · independent study · myAudience
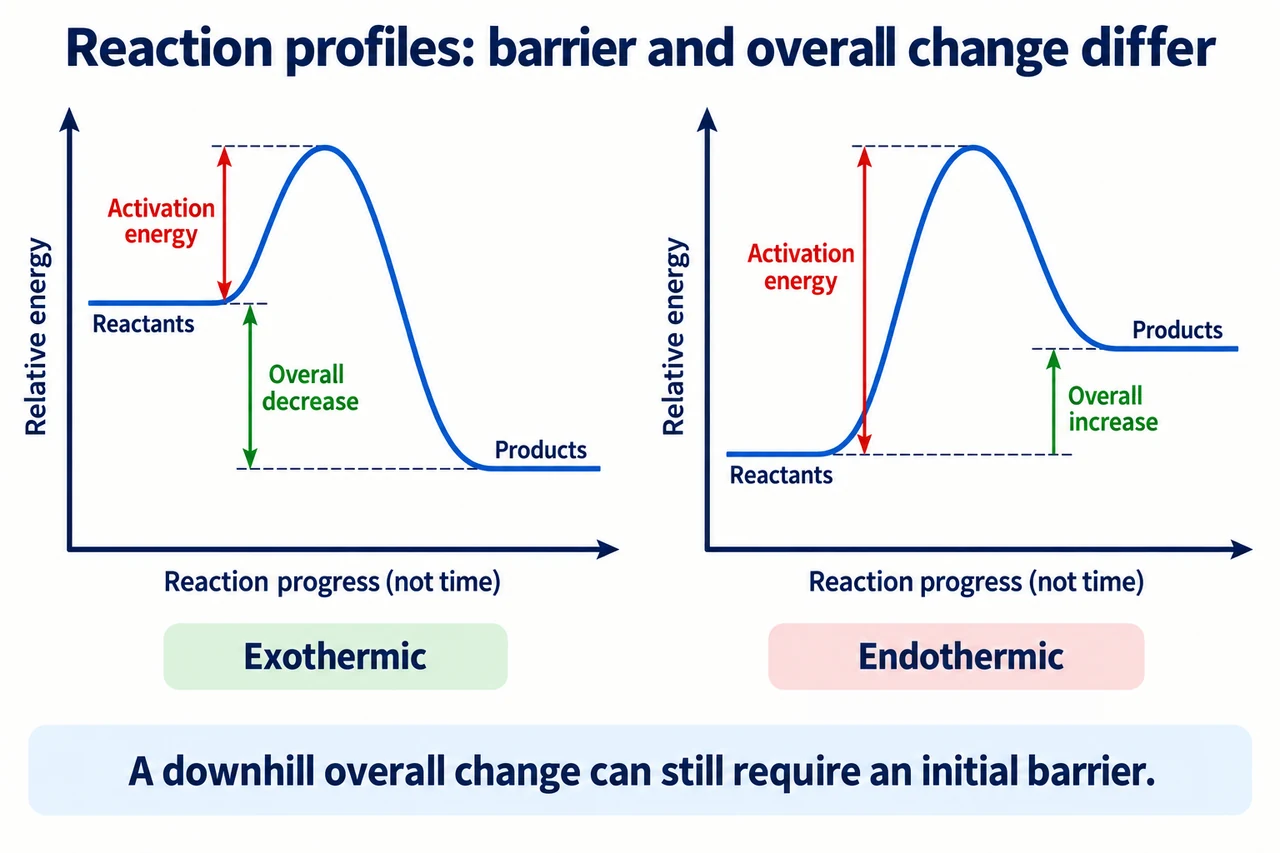
Image: illustration, not a documentary photograph. Original teaching model created for myAudience. · Original generated teaching raster; no exam-board or textbook artwork copied.
Read the barrier, not just the finish
A reaction profile compares chemical energy levels along a model of reaction progress. The vertical axis is energy, and the horizontal axis represents progress through the chemical change, not elapsed time. Reactants begin on one level, the curve reaches a barrier, and products finish on another. The profile is a conceptual explanation of why initiation and the overall energy change are different; it is not a thermometer trace, a measured mountain or a picture of atoms physically climbing a slope.
To classify the overall change, compare products with reactants. Lower products correspond to an exothermic change: energy is transferred out overall. Higher products correspond to an endothermic change: energy is taken in overall. The zero of the vertical scale is arbitrary, so moving the entire profile upwards leaves these differences unchanged. Do not compare the product level with the page baseline, and do not use the peak height above the baseline as the overall change.
Activation energy is the minimum energy associated with starting the reaction. On the simple forward profile, measure the vertical difference from reactant level to the peak, not from the axis baseline and not from product level. Even the exothermic curve has a positive barrier. The reason an overall energy-releasing reaction can need an initial input is that rearrangement must first get past that barrier. Its eventual release can then transfer energy to surroundings; the input does not reverse the classification.
In the generated plate, the left profile ends below its reactants and the right profile ends above them. Each activation arrow begins at its own reactant level. The green overall-change brackets span reactant and product levels; their two arrowheads indicate a measured interval, not two simultaneous energy flows. Neither curve carries numerical measurements or a time scale. A visually steeper section therefore cannot by itself tell you a reaction rate, a temperature or the amount of catalyst.
Use chosen energy coordinates to test your reading. If reactants are at 40, a peak at 115 and products at 10 kJ per mole of the reaction as written, the forward activation difference is 75 kJ mol−1 and the overall difference is −30 kJ mol−1. These supplied numbers are an original model, not a practical enthalpy measurement. Reversing the reaction swaps the endpoints: the overall difference becomes +30 and the reverse activation difference is 105. Reversibility of an energy diagram does not establish that the reverse reaction occurs readily in a real apparatus.
A proposed alternative pathway with the same endpoints but a lower peak changes the barrier while preserving the overall energy difference. This links the profile to the later study of catalysts without requiring an invented claim that a catalyst adds energy to the products or changes their identities. For the chosen coordinates, lowering the peak to 90 gives a forward barrier of 50 instead of 75; the overall difference remains −30. Other real pathways may have several steps, so the single-peak drawing is deliberately bounded.
Transfer challenge: a student draws an exothermic profile with products higher than reactants, labels a peak-to-product arrow as forward activation energy, and writes “the curve lasts five seconds” under a progress axis. Correct all three errors. Then show how a new profile with reactants 25, peak 95 and products 55 differs from the chosen exothermic example, and state what a profile cannot prove about the rate at room temperature.
Reasoned answer: an exothermic profile must place products below reactants; forward activation starts at reactants and ends at the peak; progress has no supplied time calibration. For the new model, 95 − 25 = 70 is the forward barrier and 55 − 25 = +30 is the endothermic overall difference. The profile alone does not supply collision conditions, rate data or an elapsed time. Author criteria reward correctly anchored differences, direction, axis interpretation and limits; copying a hump without those explanations is insufficient.
Worked example: A fictional profile has reactants at 30, peak at 110 and products at 70 kJ mol−1. Find forward activation, overall change and reverse activation; classify the forward reaction.
Forward activation is 110 − 30 = 80 kJ mol−1.
Overall products minus reactants is 70 − 30 = +40 kJ mol−1, so the forward reaction is endothermic.
For the reverse direction, the starting level is 70, so activation is 110 − 70 = 40 kJ mol−1.
Answer: Forward barrier 80; overall +40; reverse barrier 40 kJ mol−1. Each difference uses the appropriate starting level.
Check your understanding: Does lowering the peak while keeping endpoints unchanged make an endothermic reaction exothermic?
Answer: No. The overall difference still depends only on the unchanged reactant and product levels.
Why: Barrier and endpoint difference answer different questions. A lower barrier cannot substitute for a lower product level.