After shaking: find the route that keeps care reachable
By UK GCSE Geography · independent study · myAudience
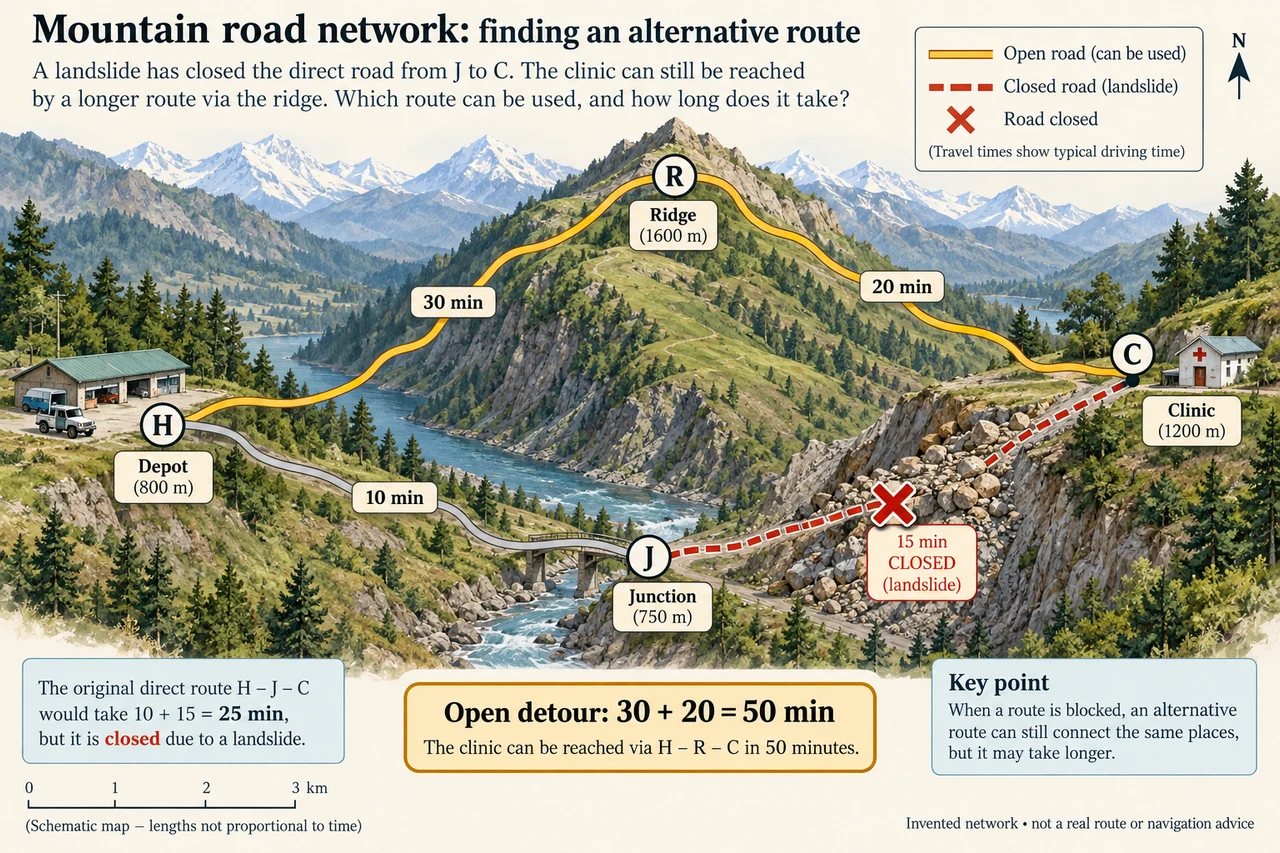
myAudience original generated educational illustration · Original commissioned illustration
After shaking: find the route that keeps care reachable
A damaged road is both a local loss and a change in a network. A clinic may remain standing but lose medicine deliveries because one connection has failed. The important geographic question becomes which places can still reach essential services, by which routes, and at what cost in time or capacity. This extends the earlier earthquake-cascade lesson from a causal chain into a worked accessibility analysis; the illustration is an invented network, not a route map of a real Nepal village.
A USGS 2017 data release about the 25 April 2015 magnitude 7.8 Gorkha earthquake and its aftershocks records a large satellite-mapped landslide inventory. It separates mapped source areas from full areas including transport and deposits, and marks obscured or incomplete coverage. Those distinctions matter: one count is not automatically the number of blocked roads, and a different inventory cannot be dismissed as wrong just because its extent or mapping method produces a different total.
The earlier course introduction cites a smaller research inventory. The 2017 USGS release instead reports 24,915 full areas and 24,795 source areas, explaining differences involving image distortion and cloud cover. Do not add the two totals as if each represented separate landslides, or compare them with the earlier 4,312 features without aligning study area, dates and definitions. A transparent analysis can use the evidence that slopes were disrupted without pretending that a satellite inventory alone measures every injured person or delayed clinic visit.
Read the four-node model carefully. H is a depot, J a junction, R a ridge route and C a clinic. Before closure, H–J–C takes 10 + 15 = 25 minutes. The J–C edge is closed by a hypothetical landslide. H–R–C remains open and takes 30 + 20 = 50 minutes. Only these four connections are supplied. Line lengths are schematic; using a ruler to infer an unlabelled shortcut would invent evidence. The detour doubles the stated travel time but not necessarily every logistical cost.
The extra 25 minutes can have different consequences depending on the service. A routine delivery may be rescheduled; time-sensitive treatment or a limited-stock clinic may face greater harm. Travel time also does not equal daily carrying capacity: a narrow route can accept only some vehicles, loading takes time, fuel may be scarce and access can change after further rain or aftershocks. The graph explains one bottleneck under stated conditions, not a complete transport or medical-risk model.
Restoring the short edge has value only if it can be done safely and remains usable. An alternative route provides redundancy, but two roads crossing the same unstable slope can fail together. That is correlated exposure, not two independent protections. Longer-term investment might diversify routes, place reserve supplies nearer communities or strengthen communications. These choices have land, maintenance and cost implications; assess them with local residents rather than treat remote villages as interchangeable dots.
Consider a second failure. If R–C is also closed, no supplied path reaches C from H. The answer is “no connection in this model”, not an infinite travel-time calculation or a newly drawn helicopter route. Air transport, walking access or a temporary crossing would need separate verified feasibility and capacity data. A strong response names the missing evidence, particularly for disabled residents, people without vehicles and households unable to pay for longer journeys.
For a transfer test, reopen J–C but change its travel time to 45 minutes because of a controlled detour: H–J–C becomes 55, so the still-open 50-minute ridge route is faster. Network position and present condition matter more than the route’s former reputation. A reasoned paragraph should connect physical disruption, a service-access effect and an immediate or longer-term response, then state the model’s limits. Neither the generated mountain scenery nor the numerical exercise is documentary evidence of conditions in Nepal today.
Worked example: Using the invented four-node plate, calculate clinic travel time before closure and after J–C closes. A return journey uses the same times and loading takes 20 min. How many complete trips fit into a 240 min working period before and after closure?
Before closure the one-way route is 25 min, so a loaded return cycle takes 25 + 25 + 20 = 70 min.
After closure the open route is 50 min, so the cycle takes 50 + 50 + 20 = 120 min.
Only complete cycles count: floor(240 ÷ 70) = 3 before and floor(240 ÷ 120) = 2 after. Payload and safety are stipulated unchanged.
Answer: One-way time increases 25→50 min, a 100% increase. Completed delivery cycles decrease 3→2, about 33.3%, not automatically 50%. Real loading, capacity and working conditions require evidence.
Check your understanding: Why does a satellite inventory of 24,915 full landslide areas not establish that 24,915 roads were closed? Then evaluate a second road that runs beside the first on the same unstable slope.
Answer: The mapped unit is a landslide area, not a road closure; some slides meet no road and some intersect several assets. A nearby second road may share the same hazard exposure, so it is not proven independent redundancy.
Why: Credit the unit-of-analysis distinction and a causal explanation of correlated route failure. A response proposing redundancy must investigate location, access, maintenance and capacity rather than count road lines alone.