A forecast cone traces a centre, not a wall around danger
By UK GCSE Geography · independent study · myAudience
myAudience original generated educational illustration · Original commissioned illustration
A forecast cone traces a centre, not a wall around danger
A forecast graphic can answer one question well while leaving another unanswered. A centre-track uncertainty region concerns where the storm’s centre may move; it is not the outer edge of all rain, wind or coastal flooding. NOAA’s explanation explicitly separates the forecast cone from the size of a tropical cyclone and warns that impacts can occur outside it. This lesson develops map interpretation rather than repeating the earlier warm-ocean formation sequence.
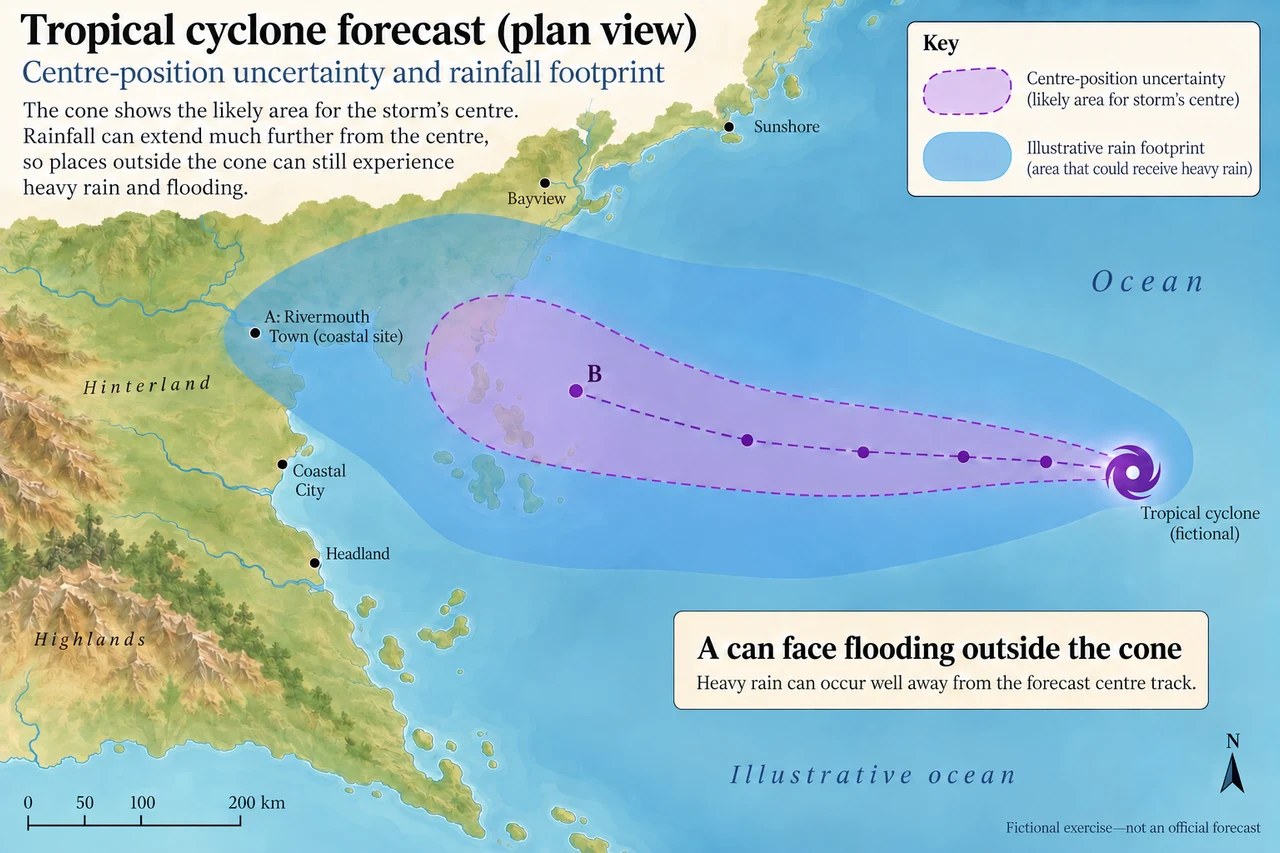
On the invented plate the violet outline represents centre-position uncertainty, while the blue region represents an illustrative rain footprint. Point A is outside the violet region but within the rain region; point B is within the violet region. These are different spatial layers. A person looking only at the violet edge would miss a potential hazard at A. Conversely, being inside it does not establish the precise rainfall, wind strength or local conditions at B, an ocean reference point rather than a depicted settlement.
A centre line is a useful reference, not a guaranteed railway track for the storm. Later forecasts can revise location, timing and intensity as observations and models change. NOAA describes observations from aircraft, satellites and other sources alongside local interpretation of vulnerable areas. The generated drawing supplies no issue time, real coastline or current official warning. It deliberately assigns no numerical confidence to its cone: operational products and their definitions must be checked in their current dated form.
Rainfall is translated into flooding through the catchment. Duration, soil wetness, slope, surface cover and drainage capacity alter runoff and river response. Therefore “outside the cone” does not mean “outside risk”, while a blue rainfall region is not a measured map of inundation depth. A river can also carry water from rain falling upstream, so a settlement may flood even if local rainfall is less exceptional. Evaluate the process connecting the meteorological forecast to the exposed place.
For a fictional assessment, forecast rain ranges from 180 to 260 mm over a 24-hour window. Dividing by 24 gives 7.5 to 10.83 mm per hour as whole-period averages. These are not the peak hourly intensities: the same total can fall steadily or in short intense bursts. A drainage system that can handle an average rate may still be overwhelmed by a burst, and using a single midpoint would hide both range and time distribution.
Compare warnings using the relevant hazard and area rather than a storm’s wind category alone. NOAA notes that rainfall and surge can remain hazardous as winds weaken. That is a distinction between variables, not proof that every weakening storm causes greater flooding. A robust school answer identifies the predicted variable, its time window, the downstream mechanism and an uncertainty; it avoids treating one number as a universal severity score.
Communication requires the map legend to survive the journey to the user. A small reposted screenshot can lose its date, legend or separate hazard layers. Accessible text, understandable place names and current official information help people interpret it. Planning also requires a feasible response: identifying potential risk is not the same as arranging transport, refuge or continuity of care. The educational map cannot certify any route or action for a real storm.
An unfamiliar transfer shows the value of layered reading. Consider two additional hypothetical settlements X and Y, distinct from the plate’s reference points. X is outside a centre region with 200 mm forecast rain upstream and saturated soils; Y is inside it with 80 mm and effective drainage. The stated information supports concern about runoff at X; it does not prove X will suffer the larger total loss because buildings, population and actual rainfall remain unknown. A strong comparison justifies a mechanism and a conditional judgement, then asks for missing evidence instead of choosing a winner from cone membership alone.
Worked example: In a fictional 24 h forecast, hypothetical settlement X receives 180–260 mm and Y 80–120 mm. These settlements are distinct from the map reference points. Calculate each range of whole-period average hourly rates. Explain why comparing these with a 10 mm/h drain limit cannot prove whether peak capacity is exceeded.
X averages 180 ÷ 24 = 7.5 to 260 ÷ 24 ≈ 10.83 mm/h; Y averages 80 ÷ 24 ≈ 3.33 to 120 ÷ 24 = 5 mm/h.
X’s upper total implies a whole-period average above 10; Y’s whole-period average is below 10. These summaries do not supply hourly profiles or catchment inflows.
Short bursts can exceed 10 even when the daily average is below it. Actual runoff and drainage also differ from rain directly measured at a point.
Answer: The averages are X 7.5–10.83 mm/h and Y 3.33–5 mm/h. Peak intensity and realised flooding require additional temporal/catchment evidence; cone position cannot supply it.
Check your understanding: A post says “The storm is weakening and our town is outside the cone, so no flood planning is needed.” Write a reasoned correction, then identify two specific missing layers.
Answer: Wind-based weakening does not establish weaker rainfall or surge. The cone concerns the centre, while impacts extend beyond it. Obtain current rainfall/catchment and coastal-inundation or local river evidence relevant to the town, with issue times and official guidance.
Why: Credit separate variables, a linked flood mechanism and dated relevant evidence requests. Merely stating that forecasts are uncertain, or promising flooding everywhere outside the cone, is insufficient.