Measure coastal water from one datum before judging flood depth
By UK GCSE Geography · independent study · myAudience
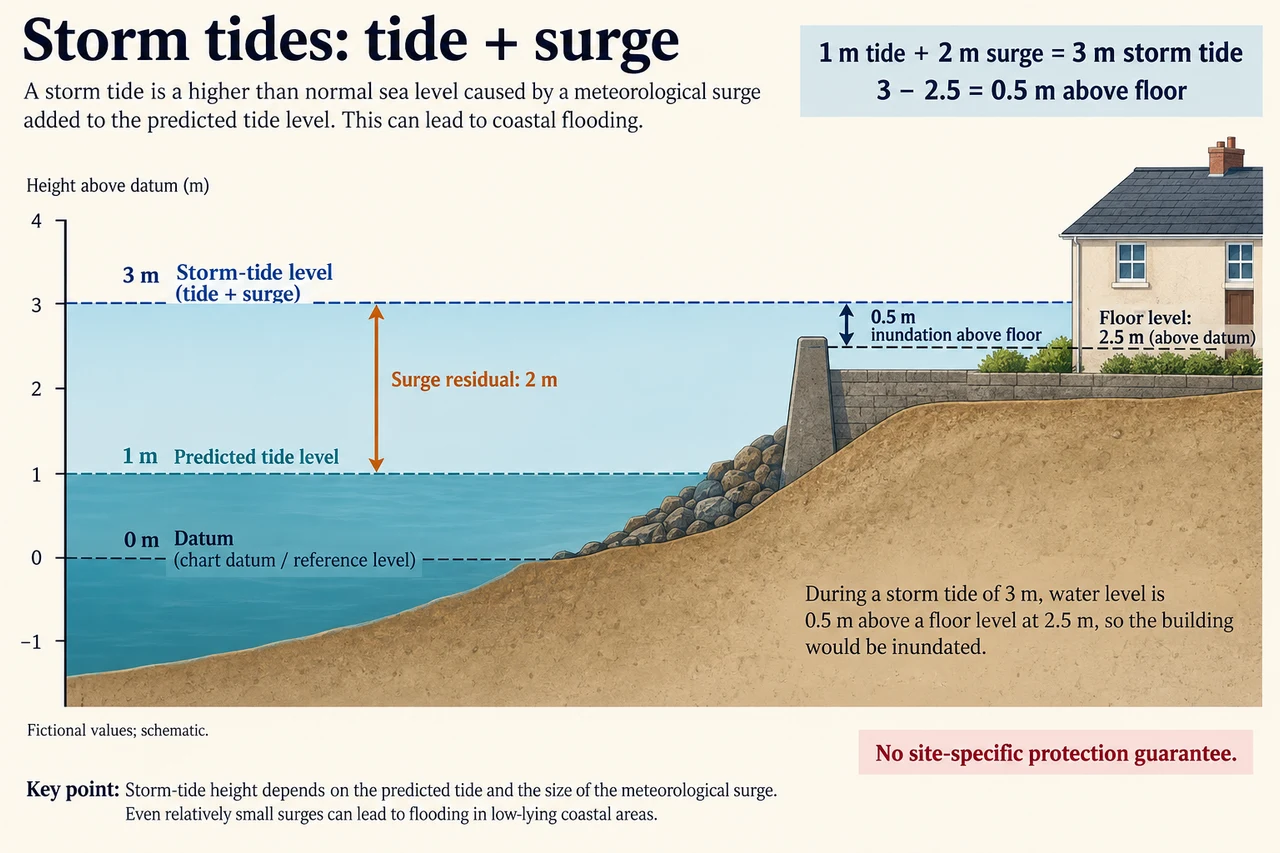
myAudience original generated educational illustration · Original commissioned illustration
Measure coastal water from one datum before judging flood depth
Coastal flooding figures make sense only when their reference is clear. Water height above a survey datum, the extra height above a predicted tide and the depth above a building floor are different quantities. NOAA defines storm surge as the storm-driven rise relative to the normal predicted astronomical tide and storm tide as their combined level. This lesson adds vertical-reference reasoning to the earlier tropical-cyclone and hazard-risk introductions.
Wind pushing water towards a coast is a principal surge mechanism. Storm track, size, intensity, speed, coastline orientation and seabed depth alter the local response. The same central wind category therefore does not determine one universal surge height. Astronomical tide also varies through time and place. A coast can face higher total water when a large surge coincides with high tide, but timing and physical interactions require a local forecast rather than a slogan about every full moon.
Read the plate’s fictional datum first. Predicted tide is 1 m above it and storm-tide level 3 m, so the residual called surge is 3 − 1 = 2 m. The floor is 2.5 m above the same datum, giving a 0.5 m water-level exceedance above the floor. These are schematic stipulated levels, not actual observations, site elevations or engineering design values. The arithmetic does not include individual wave crests, spray, local flow velocity or pressure on a wall.
Keep an explicit bookkeeping model: observed level = predicted tide + residual. It helps distinguish variables, but it does not prove that surge and tide act as physically independent fixed additions in every real setting. Friction, changing water depth and coastal geometry can alter interactions. The simple exercise holds its quantities fixed so that a reference error is visible; real model outputs need their definitions and datum checked before combining them.
A floor-height comparison can describe one exposure threshold while missing others. Roads, substations, water supplies and neighbouring homes can be affected even if occupied rooms stay above the chosen level. A 0.5 m exceedance in this idealised still-water comparison is not a universal prediction of indoor depth: walls, openings, drains and dynamic water movement matter. Neither a raised floor nor a defence label establishes complete protection.
Uncertainty is decisive near a threshold. If a stipulated water estimate spans 2.7–3.3 m and surveyed floor height 2.4–2.6 m, the possible exceedance spans 2.7 − 2.6 = 0.1 to 3.3 − 2.4 = 0.9 m. This interval calculation does not assign each value an equal probability. An unknown datum offset can shift the whole comparison, so better precision on the water alone may not resolve a reference mismatch.
Management should follow the mechanisms and the people exposed. Warnings and accessible plans reduce response gaps; raised infrastructure and appropriate barriers may reduce selected physical vulnerabilities; land-use choices alter future exposure. All require maintenance and local assessment. Diverting water or encouraging new development behind a defence can move or increase risk. A geographic judgement must therefore examine costs and effects beyond the single protected floor.
For transfer, lower the predicted tide to − 0.5 m while stipulating the same 2 m residual: the total becomes 1.5 m, not 2.5 m. It lies 1 m below the model floor, but that does not certify safety from waves or other failures. Explain exactly which risk has been compared and which remains outside the model. Use current official forecasts and local instructions for real events; this illustration teaches reference systems rather than an operational protection standard.
Worked example: A fictional forecast gives predicted tide 1.2 m and a 2.1 m residual above one datum. A doorway threshold is 2.8 m above that same datum. Calculate total level and exceedance. A second report gives threshold 4.0 m using a datum 1.2 m lower: are the reports inconsistent?
Total level: 1.2 + 2.1 = 3.3 m. Exceedance above threshold: 3.3 − 2.8 = 0.5 m.
A datum 1.2 m lower assigns every unchanged physical point a numerical height 1.2 m greater. The threshold becomes 2.8 + 1.2 = 4.0 m.
Under that datum the water is 3.3 + 1.2 = 4.5 m, so exceedance remains 4.5 − 4.0 = 0.5 m. Mixing 4.0 with the original 3.3 would be invalid.
Answer: The two correctly referenced reports agree: 0.5 m exceedance in the stipulated comparison. Numerical height changes with datum; physical separation does not.
Check your understanding: A headline calls a 3 m storm tide “a 3 m surge”. Correct it using the plate. Then explain why equal surge residuals at two coasts need not produce equal household disruption.
Answer: In this plate 3 m is total storm tide and 2 m is surge above the 1 m predicted tide. Tide, ground/floor levels, waves, exposure, access and services differ between coasts, so equal residuals do not establish equal impacts.
Why: Credit the correct reference and arithmetic plus a linked exposure/response explanation. An answer equating water height to universal indoor depth or interpreting a higher floor as zero risk remains incomplete.