July 2022 heat: a verified station is evidence, not a whole-country average
By UK GCSE Geography · independent study · myAudience
myAudience original generated educational illustration · Original commissioned illustration
July 2022 heat: a verified station is evidence, not a whole-country average
The 19 July 2022 UK heat event provides a second dated UK-weather example alongside the existing Babet flooding lesson. The Met Office event report records 40.3°C at Coningsby, Lincolnshire. Its 28 July 2022 verification release confirms the record after quality checks. asks about causes, social/economic/environmental effects and management; this lesson concentrates on observation quality and unequal exposure, while the broader case and trend evidence remain tasks to continue.
A station maximum is a measurement at a place and time, not the temperature of every UK neighbourhood or the country’s daily mean. The Met Office report explains hot air moving north from the near-continent and gives station-specific records. Those weather conditions concern the event mechanism; climate change concerns the background distribution of heat. One hot reading alone cannot separate those causes or quantify how likely the event would have been without human influence.
Quality control is part of the evidence, not an inconvenient adjustment after the story. The Met Office verification account describes instrument checks, cross-checking and physical site inspections. It rejected the provisional Floors Castle national-record claim because the site setup did not meet observing standards. Changing that status does not imply all records were fabricated; it shows why a provisional claim and a verified one must be distinguished with their dates and definitions.
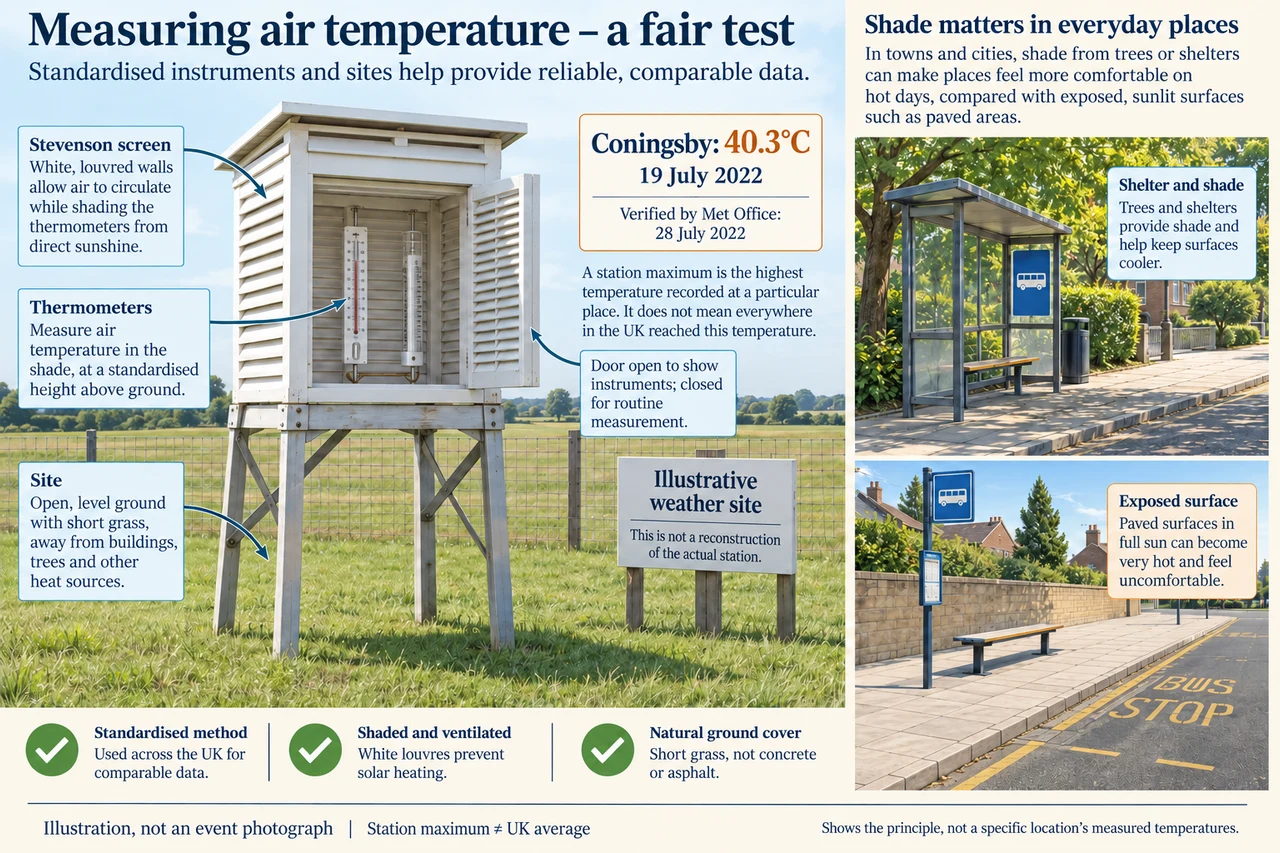
The image depicts a white ventilated Stevenson screen over grass, shielding the instrument from direct sun while allowing airflow. It is an explanatory illustration, not a photograph of Coningsby’s instrument or a reconstruction of its exact site. The adjacent shade/access scene is also invented. A thermometer on an exposed sunlit wall can answer a different local question, but its reading cannot simply be substituted for a standardised air-temperature series without understanding the measurement conditions.
Compare like variables and periods. In a fictional exercise, a daily maximum 39°C is compared with a monthly-average daily maximum 24°C: the difference is 15°C, not a claim that that day’s mean or every night was 15°C warmer. Temperature in Celsius is not a ratio scale, so “62.5% hotter” is misleading. A consistent sequence across many years is needed for a trend; selecting only record-breaking days changes the sampling question.
Heat disruption links exposure to housing, work, transport and services. Shade at a bus stop can reduce direct solar exposure during some hours; access to water, ventilation, reachable services and workable plans affects consequences. People with mobility barriers may be unable to reach a distant cooling facility. These are mechanisms to investigate, not measured local 2022 effects in the generated streetscape or individual medical advice. Actual health and infrastructure claims need their own dated evidence.
Suppose a survey of 200 fictional residents finds 120 use a new shade area, while only 20 of the 80 residents reporting access barriers can reach it. Overall observed use is 60%, but barrier-group reach is 25%. The totals describe different denominators and cannot show what temperature reduction or avoided harm occurred. Ask about opening hours, actual conditions and overlap between categories, and involve residents in checking whether the proposed route is feasible.
An unfamiliar-source response should name the variable, location, date, method and status before drawing a conclusion. If a screenshot claims a national record from an unverified sunlit-surface sensor, request the instrument conditions and official verification rather than accepting or rejecting it based on whether the number fits expectations. Then connect a bounded management measure to a particular exposure gap and say how its effectiveness could be measured. This is more defensible than presenting a glossy illustration as proof of reduced heat risk.
Worked example: In a fictional town,120 of 200 residents use a new shade area; 20 of 80 residents with access barriers can reach it. Calculate both shares. If all 20 belong to the 120 users, calculate reach among the 120 residents without reported barriers. What outcome is not measured?
Overall use: 120 ÷ 200 × 100 = 60%; barrier-group reach: 20 ÷ 80 × 100 = 25%.
Without reported barriers: 100 users out of 120 residents, so 100 ÷ 120 × 100 ≈ 83.3%, using the stipulated overlap.
The counts do not measure heat reduction, health benefit or exposure over the whole day. Group reach and actual outcomes need separate evidence.
Answer: The shares are 60%,25% and about 83.3%. A favourable overall number can coexist with a substantial access gap; it is not evidence of a measured health benefit.
Check your understanding: Explain why the verified 40.3°C maximum cannot be presented as the UK mean. Then evaluate whether a 62.5% Celsius-temperature increase is an appropriate account of the fictional 39°C versus 24°C comparison.
Answer: 40.3°C is a station maximum with a stated location/date, not an area or time average. The fictional difference is 15°C; percentage change in Celsius depends on its arbitrary zero and is misleading as a statement of relative warmth.
Why: Credit variable and scale distinctions, the difference in degrees and a source-status check. Additional heat-management conclusions require identified mechanisms and evidence, not a national mean invented from one station.