A one-percent annual chance does not reserve a flood for one century
By UK GCSE Geography · independent study · myAudience
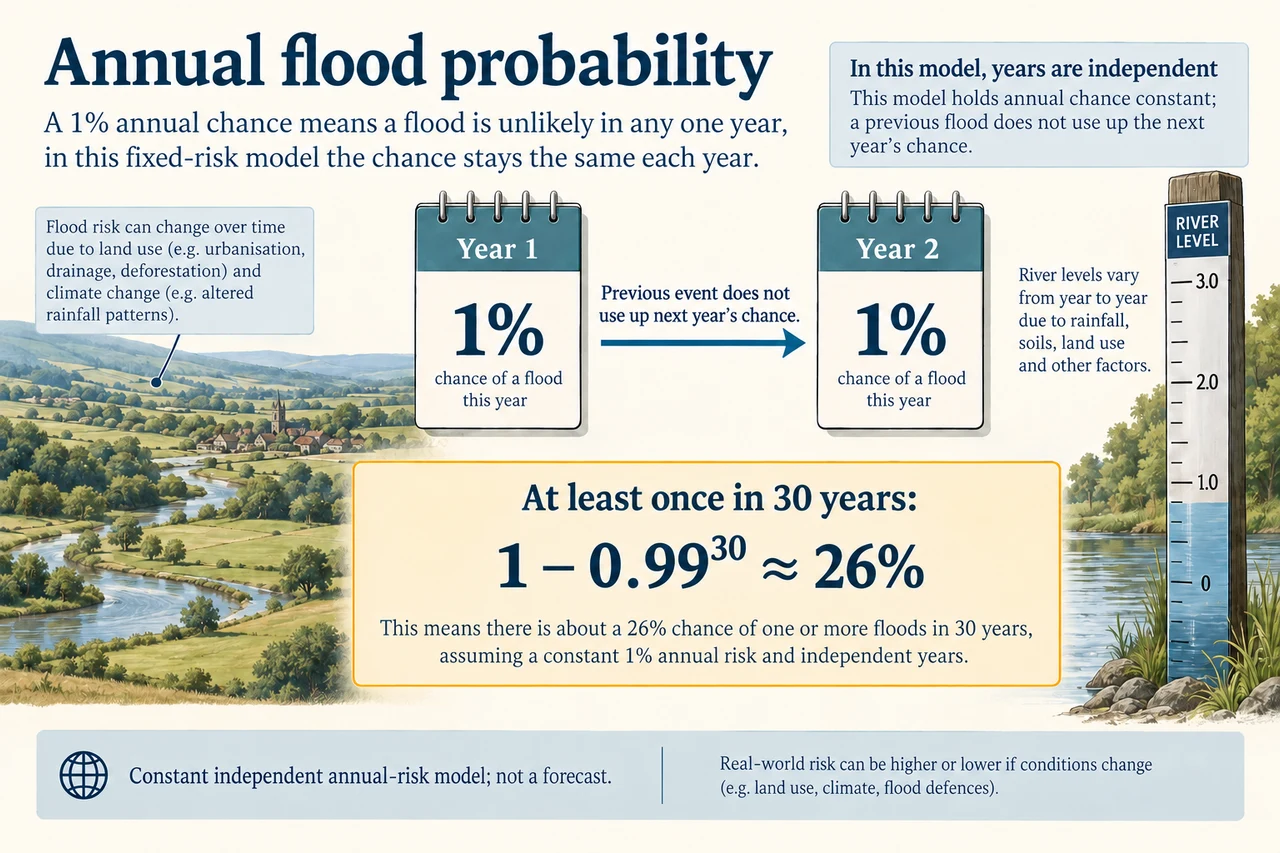
myAudience original generated educational illustration · Original commissioned illustration
A one-percent annual chance does not reserve a flood for one century
A low annual chance can accumulate into a substantial chance over a long occupancy period. Calling an event “one in a hundred years” often invites the mistaken idea that a recent flood has used up the next century’s quota. USGS instead explains annual exceedance probability: a stated threshold may have a 1% chance of being reached or exceeded in a given year. This lesson develops conditional numerical reasoning, not a prediction of exactly when the next event will occur.
The plate stipulates a fixed 1% annual chance and independent years. Those are modelling assumptions, not universal properties of rivers. Under them, no exceedance in one year has probability 0.99. No exceedance in two successive years has probability 0.99 × 0.99 = 0.9801; the complementary chance of at least one is 1 − 0.9801 = 0.0199, or 1.99%. Simply adding 1% + 1% counts the overlap of two-event possibilities twice.
Extending the same stipulated model to 30 years gives no exceedance probability 0.99³⁰, about 0.7397, and at least one about 0.2603, or 26.0%. This is not a 26% chance every year, a promise of exactly one flood in 30 years or the chance that all residents lose their homes. The threshold, location and event definition must remain stated. The exponent formula is an explanatory extension; it is not advertised as a separate mandatory probability topic.
USGS explains that flood estimates can be revised as observations accumulate and that dams or urban development can change a basin. Climate, land use and river management can therefore make a historical estimate unsuitable for a future period. Independence also needs examination where years share long-lived conditions. An honest answer should say when its fixed-risk calculation is useful and when its assumptions need replacing; writing more decimal places does not repair an inappropriate model.
Rainfall rarity and river-flood rarity are not interchangeable. USGS describes the importance of rainfall extent, previous soil saturation, catchment size and event duration. A rare rainfall total at one gauge need not produce a flood of the same annual probability throughout a basin. This develops the forecast-map lesson’s distinction between meteorological information and realised runoff, rather than assuming that every “100-year” label measures the same physical event.
Event attribution asks a different comparison: how would an event’s probability or intensity differ under a defined climate without a selected influence? In an invented model, a heat threshold has annual probability 0.02 in one scenario and 0.10 in another. The risk ratio is 0.10 ÷ 0.02 = 5; the absolute difference is 0.08, or 8 percentage points. Neither states that the event was five times hotter, that all its harm had one cause or that those model values describe the actual 2022 UK heatwave.
Expected loss is another variable again. For a simplified fictional threshold event with probability 0.01 and a stipulated £200,000 loss if it occurs, that category contributes £2,000 per year to expected loss. It does not predict an annual £2,000 bill; most years may have none and some a large loss. Other event sizes, indirect disruption and unequal household capacity are omitted. A decision about protection should not treat this narrow average as a complete valuation of wellbeing.
For demanding transfer, use a varying but independent model with 2% chance in each of the first 10 years and 4% in each of the next 10. No exceedance has probability 0.98¹⁰ × 0.96¹⁰; at least one is about 45.7%. An arithmetic average annual chance of 3% is not an exact substitute, although it produces a nearby answer. State the intervals and independence assumption, distinguish conditional probability from exposure and explain what data would justify the changing probabilities before applying this method to a real place.
Worked example: Under a fictional constant independent 2% annual exceedance model, find the chance of at least one exceedance over 10 years. Then compare a hypothetical adaptation reducing annual chance to 1%, holding the threshold definition fixed. Calculate absolute and relative reductions in the 10-year chance.
Before: 1 − 0.98¹⁰ ≈ 0.182927, or 18.29%. After: 1 − 0.99¹⁰ ≈ 0.095618, or 9.56%.
Absolute reduction: 18.2927 − 9.5618 ≈ 8.7309 percentage points.
Relative reduction: 0.087309 ÷ 0.182927 × 100 ≈ 47.73%. Keep the model/threshold conditions explicit; do not state that damages fall by the same share.
Answer: The modelled chance falls 18.29%→9.56%: 8.73 percentage points, or about 47.73% relative reduction. Harm also depends on event severity, exposure and vulnerability.
Check your understanding: An invented attribution report raises an annual heat-threshold probability from 2% to 10%. Correct “an 80% rise makes it five times hotter”. Then explain why one exceedance does not prove the model probabilities.
Answer: It is a fivefold probability ratio, an 8-percentage-point increase and a 400% relative probability increase—not a temperature multiplier. One occurrence does not reveal the underlying probabilities or establish attribution without the model/data comparison.
Why: Credit distinct denominators and units, the correct ratio/change calculations and an evidence/model limitation. Advanced calculations are explanatory extensions, not claims of independent assessed mastery or actual event attribution.