Count the people a protection plan misses, as well as those it reaches
By UK GCSE Geography · independent study · myAudience
myAudience original generated educational illustration · Original commissioned illustration
Count the people a protection plan misses, as well as those it reaches
An adaptation plan can improve an overall count while leaving an important group poorly served. climate-management content asks about responding to change; UNDRR defines risk reduction to include preventing new risk, reducing existing risk and managing what remains. This lesson adds an explicit distributional appraisal. It compares invented heat-access plans, not a real municipal decision or proof that either illustrated facility has produced a measured health outcome.
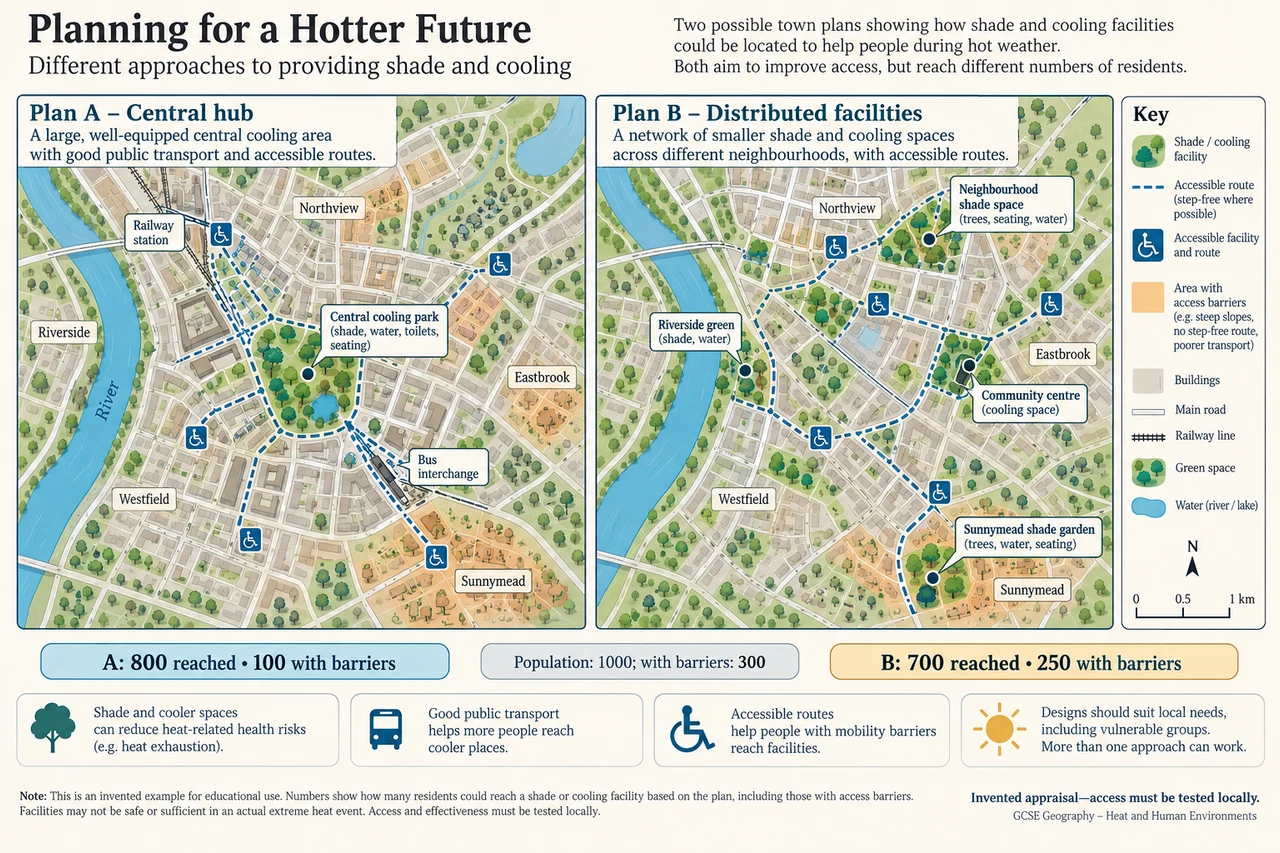
The town has 1000 residents, of whom 300 report access barriers. The remaining 700 do not report those barriers in the exercise; that label does not imply that they can never face vulnerability. Plan A reaches 800 residents including 100 from the barrier group. Plan B reaches 700 including 250 from that group. Read “including” carefully: the subgroup is part of each total, not an additional population. Summing 800 + 100 would double-count 100 people.
Overall reach is 80% for A and 70% for B. Within the barrier group it is 100 ÷ 300 ≈ 33.3% for A and 250 ÷ 300 ≈ 83.3% for B. Among the other 700 residents, the implied reach is 700 ÷ 700 = 100% for A and 450 ÷ 700 ≈ 64.3% for B. The larger aggregate plan reaches 100 more people, but the distributed plan reaches 150 more people facing the specified barriers. No single one of these percentages fully describes the distribution.
The plate suggests a central hub versus distributed sites and routes. Its accessible symbols express a design intention, not the result of a real accessibility audit. Slope, opening times, queueing, surface condition, cost, transport and support needs can make a nominal route unusable. A wheelchair icon is not a definition of every access barrier; sensory, language, financial or care-related constraints may also matter. Ask residents to check whether the supposed improvement works in practice.
Separate reach from effectiveness. Being able to get to a shade or cooling facility does not establish how much heat exposure is reduced, whether it is open during the worst hours or whether it has sufficient capacity. A facility may be reachable by 800 people but serve only 200 at once. An appraisal must specify whether its unit is unique residents, visits, occupied places or exposure-hours, and use a consistent time window. Counting repeated visits as newly protected residents would inflate performance.
A fictional cost extension assignsA £2 million and B £2.4 million over the same defined period and scope. Cost per resident reached is £2500 for A and about £3429 for B. This narrow efficiency measure favoursA, but it ignores depth of benefit, distribution, upkeep, residual risk and alternative uses of funds. Cost per reached member of the barrier group is £20,000 versus £9600; neither ratio is a literal price on a human life or a complete welfare evaluation.
Trade-offs should be argued rather than hidden in an unexplained weighted score. A group prioritising maximum total reach under a strict £2 million budget may selectA; one prioritising access-gap reduction with £2.4 million available may preferB. Those are conditional judgements with explicit goals, not objective proof that one plan is always fairer. A combined or redesigned plan might improve both measures, but its extra reach, costs and capacity would need evidence rather than an invented assumption.
A robust conclusion sets a review process: check barrier-group access with residents, observe actual operating hours and capacity, measure relevant exposure conditions and monitor unintended impacts elsewhere. Shade provision responds to heat, so its adaptation rationale is distinct from an emissions-mitigation claim requiring separate evidence. New facilities also need maintenance and must not encourage unsupported guarantees of safety. A reasoned answer identifies the chosen goal, uses the appropriate denominator, acknowledges who remains unserved and names the data that could overturn its judgement.
Worked example: For the invented population/plan data in the plate, calculate residents with barriers still unserved and residents without reported barriers still unserved under each plan. Under a £2.4 m budget, give two contrasting justified choices rather than a universal winner.
A leaves 300 − 100 = 200 residents with barriers unserved and 700 − 700 = 0 of the other group. B leaves 300 − 250 = 50 with barriers and 700 − 450 = 250 of the other group.
A leaves 200 people unserved overall; B leaves 300. Yet B reduces the barrier-group gap by 150 relative to A.
A is defensible for maximum stated total reach/cost efficiency; B for the declared goal of reducing this access gap, if capacity and effectiveness are comparable. Both require evidence and can leave substantial residual risk.
Answer: A unserved: 200 with barriers/0 without reported barriers. B: 50/250. Goal and assumptions determine a conditional recommendation; the counts do not establish actual health benefits.
Check your understanding: A publicity post adds the total and subgroup to claimA protects 900 and B 950. Correct it, then propose one measure that would distinguish nominal access from actual effectiveness.
Answer: The subgroup is already included: reach remains 800 for A and 700 for B. Check actual accessible use/capacity and relevant exposure reduction over stated operating hours, while recording distinct residents rather than repeated visits.
Why: Credit correct inclusion/denominators, explicit distributional reasoning and a feasible indicator with a clear time/unit definition. A list of facilities or an unsupported claim of universal fairness is not enough.