Price elasticity of demand: percentages, revenue and inference
By UK A Level Economics · independent study · myAudience
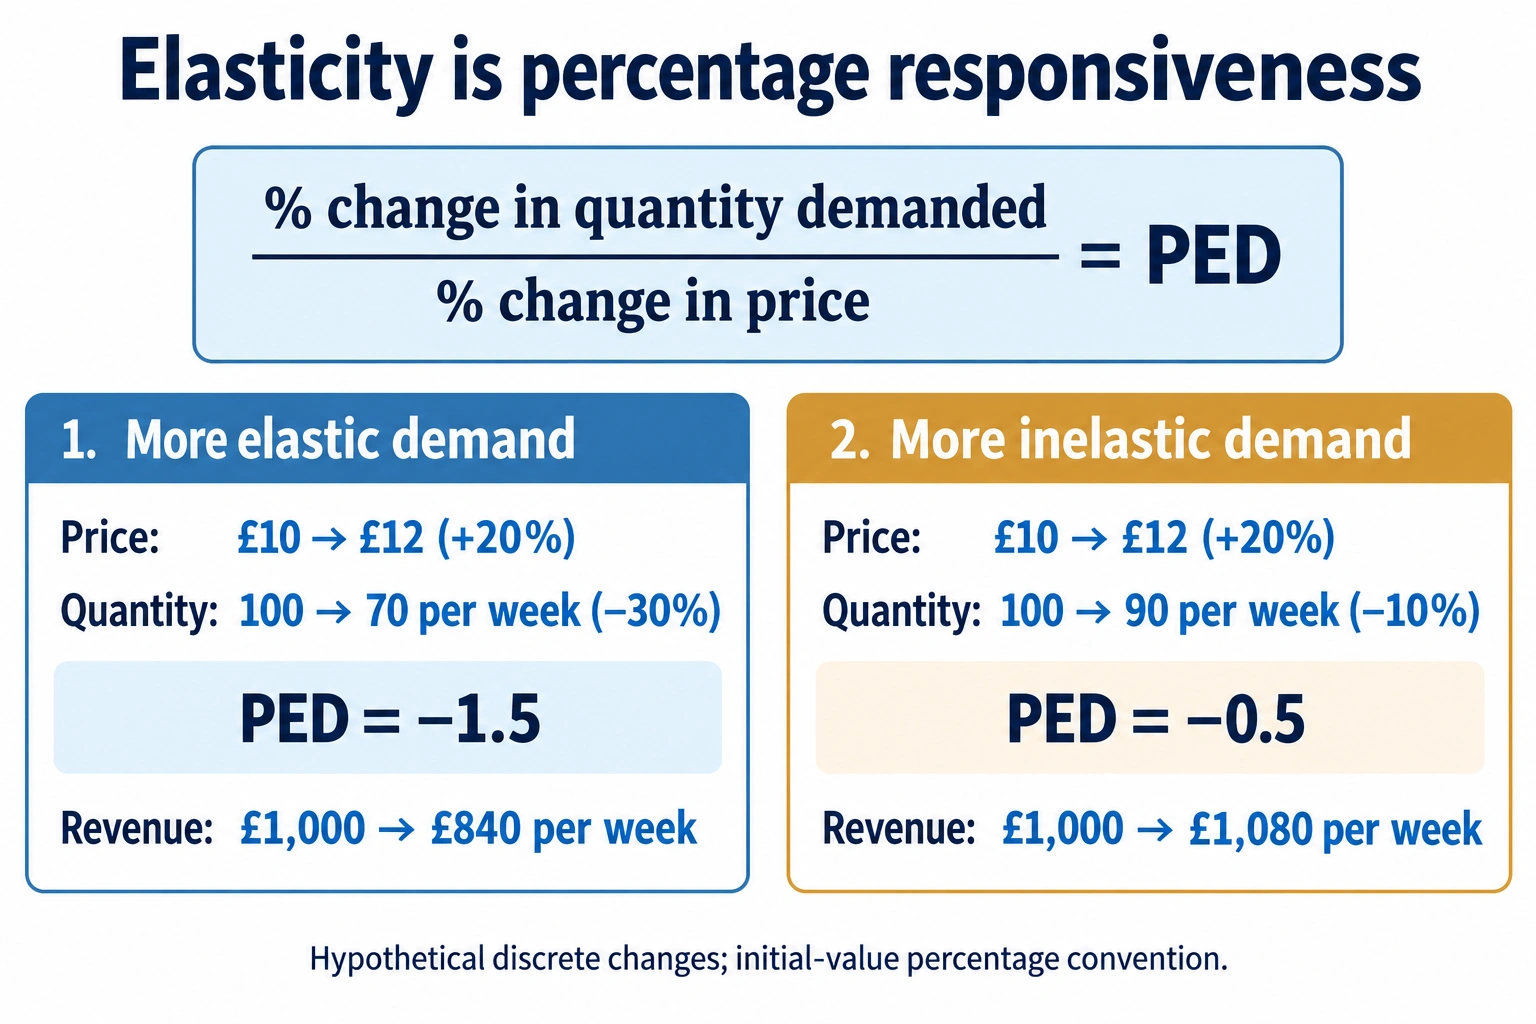
Original teaching plate generated using the built-in imagegen tool, 2026-10-04; conceptual or hypothetical, not empirical evidence. · Original generated artwork; provenance and rights acceptance pending independent review before public publication.
Price elasticity of demand: percentages, revenue and inference
Price elasticity of demand (PED) measures percentage responsiveness of quantity demanded to its own price, other demand determinants fixed. Divide percentage quantity change by percentage price change. Usually PED is negative because price and quantity move oppositely; the magnitude indicates responsiveness. A magnitude above one is elastic, below one inelastic, and exactly one unit elastic. Zero means no quantity response in the specified range. Elasticity is unit-free because percentages cancel; a slope measured in tickets per pound is not. A straight demand line can have changing elasticity along it.
For these discrete examples use the initial-value convention: change divided by original value. Explicitly retain the negative quantity sign. Price £10→£12 is +20%, while quantity 100→70 is −30%, giving PED −1.5. Reversing direction gives different initial denominators. A midpoint or arc convention reduces that directional asymmetry but must be named; do not silently mix conventions. Point elasticity concerns a very small change at a point. An elasticity estimated over one finite interval is not a universal constant for all prices or groups.
Total revenue is price times quantity sold during a period, not profit. The plate compares £1,000→£840 per week under the elastic example and £1,000→£1,080 under an inelastic example. In the first, the quantity loss outweighs the price gain; in the second, it does not. For small price changes the familiar elasticity/revenue rule is direct. For a finite initial-value calculation, compute revenue explicitly: percentage products include an interaction term. A calculated initial-value PED of exactly −1 over a large price increase does not guarantee unchanged revenue. The example below makes that limit visible.
Responsiveness depends on feasible substitutes, necessity, budget share, market definition and time. Demand for one cinema can be more elastic than demand for all leisure if alternatives exist within the broader category. A medicine may be essential, but demand for a particular brand can respond strongly if an equivalent substitute is available. Time permits search and adaptation, although not every group has equal options. Treat "necessity" as a mechanism to examine, not a sufficient empirical estimate. A low-income household can face both high need and a binding budget that makes price changes consequential.
Inferring PED from successive observed prices and sales requires isolating a price change along a stable demand relationship. Popularity, quality, income or population changes can shift demand during the interval. Supply-driven exogenous price changes can sometimes help identify demand, but their exclusion assumptions need justification. Promotional price cuts may coincide with advertising, so their sales increase can exaggerate a causal price response. Revenue records may also include multiple products or taxes. A numerical answer is only as informative as the market, period, convention and identification assumptions that produced it.
For extended evaluation, use an elasticity estimate as one piece of a decision. A revenue-maximising price is not necessarily a profit-maximising one because output costs change. Nor does higher revenue demonstrate improved consumer welfare or fairness. Estimate robustness across groups, compare short and long horizons, and consider competitors' responses. A price rise may increase revenue in an inelastic range yet reduce access for a vulnerable minority. A warranted recommendation specifies the objective, plausible response range and evidence that would cause revision. These qualifications should follow the calculation, not replace doing it.
Original model essay — part 1. An estimated price elasticity of demand of minus 0.5 does not make a 20% price rise certainly the best decision. Elasticity describes a proportional response under stated conditions; it does not directly measure profit or social benefit. If the estimate reflects a causal, stable response for the relevant customers and range, relatively inelastic demand suggests that a price rise could increase revenue. Those conditions are substantive. A manager should examine identification, costs, customer differences and longer-term responses before treating the estimate as a policy rule. In the hypothetical inelastic case, price rises from ten to twelve pounds and quantity falls from 100 to 90. Using initial values, the changes are plus 20% and minus 10%, so PED is minus 0.5. Revenue rises from 1,000 to 1,080 pounds. The elastic comparison gives quantity 70, PED minus 1.5 and revenue 840 pounds. This contrast explains the revenue mechanism, but neither outcome identifies profit without information about costs. If supplying fewer units saves substantial variable costs, the profit effect differs from the revenue change. Fixed costs and investment commitments matter for overall viability as well. Finite changes also require consistent percentage conventions. In the initial-value example with quantity falling from 100 to 80, PED is minus one, yet revenue becomes 960 rather than remaining 1,000. Exact unchanged revenue at twelve pounds requires approximately 83.33 units. The familiar unit-elastic revenue result must not be applied mechanically to a finite initial-value calculation. A midpoint calculation uses different denominators and produces a different elasticity. Stating the method avoids a contradiction that would otherwise be mistaken for a failure of the economic mechanism.
Original model essay — part 2. If the earlier price rise occurred during a marketing campaign, observed sales may combine a price effect with a rightward demand shift. Dividing those observed percentage changes does not isolate movement along a stable curve. The underlying price response could be more elastic than minus 0.5, with advertising offsetting the lost sales. A credible comparison should account for exposure to the campaign and other changes, or use a design where price variation is independent of demand shocks. Repeated results across comparable periods would be more convincing than one before-and-after ratio. Responses may also change over time. Customers who initially lack substitutes may later switch providers or reduce use. An aggregate estimate can conceal a vulnerable group with a much stronger response, particularly when the product is essential. A revenue-maximising decision could therefore reduce access even if it improves the seller's finances. A public or charitable provider needs to state whether financial sustainability, service use or distribution is its objective. Evidence about satisfaction, repeat purchases and substitute availability would improve the decision. I would support a carefully monitored price change only if the estimate is credible for the proposed range and the resulting net benefit meets the organisation's objective. A smaller trial with an explicit comparison could reduce uncertainty, though it also has administrative and fairness costs. The numerical example supports a possible revenue increase, not certainty or universal optimality. The final judgement should explain which assumptions carry the prediction and what findings would justify changing it.
Worked example: Hypothetical price £10→£12. Case E quantity 100→70/week; case I 100→90/week; case U 100→80/week. Calculate initial-value PED and revenues; explain the finite-change unit-elastic trap.
Price change is +20%. E quantity change −30% gives PED=−1.5; I −10% gives −0.5; U −20% gives −1.
Initial revenue in each is £10×100=£1,000/week. E final £12×70=£840; I £12×90=£1,080; U £12×80=£960.
U loses £40 despite initial-value PED=−1. Algebra: 1.20×0.80=0.96, because the finite percentage changes multiply.
The midpoint PED for U is (−20/90)/(2/11)=−11/9≈−1.222; it is not unit elastic by that convention.
Equal revenue at £12 requires 1000/12≈83.333 units/week, assuming divisible output, not 80.
Answer: E: −1.5 and £840; I: −0.5 and £1,080; U: −1 and £960. State the convention and calculate finite revenues; use the unit-elastic revenue rule carefully.
Check your understanding: Write 450–600 words evaluating a cinema manager's claim: "Our observed PED is −0.5, so a 20% price rise is certainly best." Use original arithmetic, identify at least two estimation risks and distinguish revenue, profit and access. Transfer: marketing changes at the same time as the price.
Answer: Under the supplied stable-demand initial-value example, quantity falls 10% and revenue rises 8%, from £1,000 to £1,080. That does not establish profit because costs and taxes may change, nor establish that a larger price increase remains in the same elasticity range. Advertising may shift demand and confound the observed response; competitor prices, product quality and customer composition also matter. Access effects may be concentrated among low-income buyers despite a modest aggregate quantity loss. Test estimates across periods/groups and distinguish price experiments from concurrent campaigns. Recommend the increase only conditionally on the objective, credible response and costs; a different recommendation can be defended with distributional evidence.
Why: Indicative criteria: percentages with initial denominators and signs; revenue multiplication with units/time; explicit finite-change caveat; causal identification risks with mechanisms; distinguish profit and welfare; contextual and revisable judgement. Reward a properly labelled arc convention if applied consistently, but do not accept a change of convention to hide the £960 result. This original exercise is not an tariff or official marking grid.