Income and cross-price elasticity: classification with limits
By UK A Level Economics · independent study · myAudience
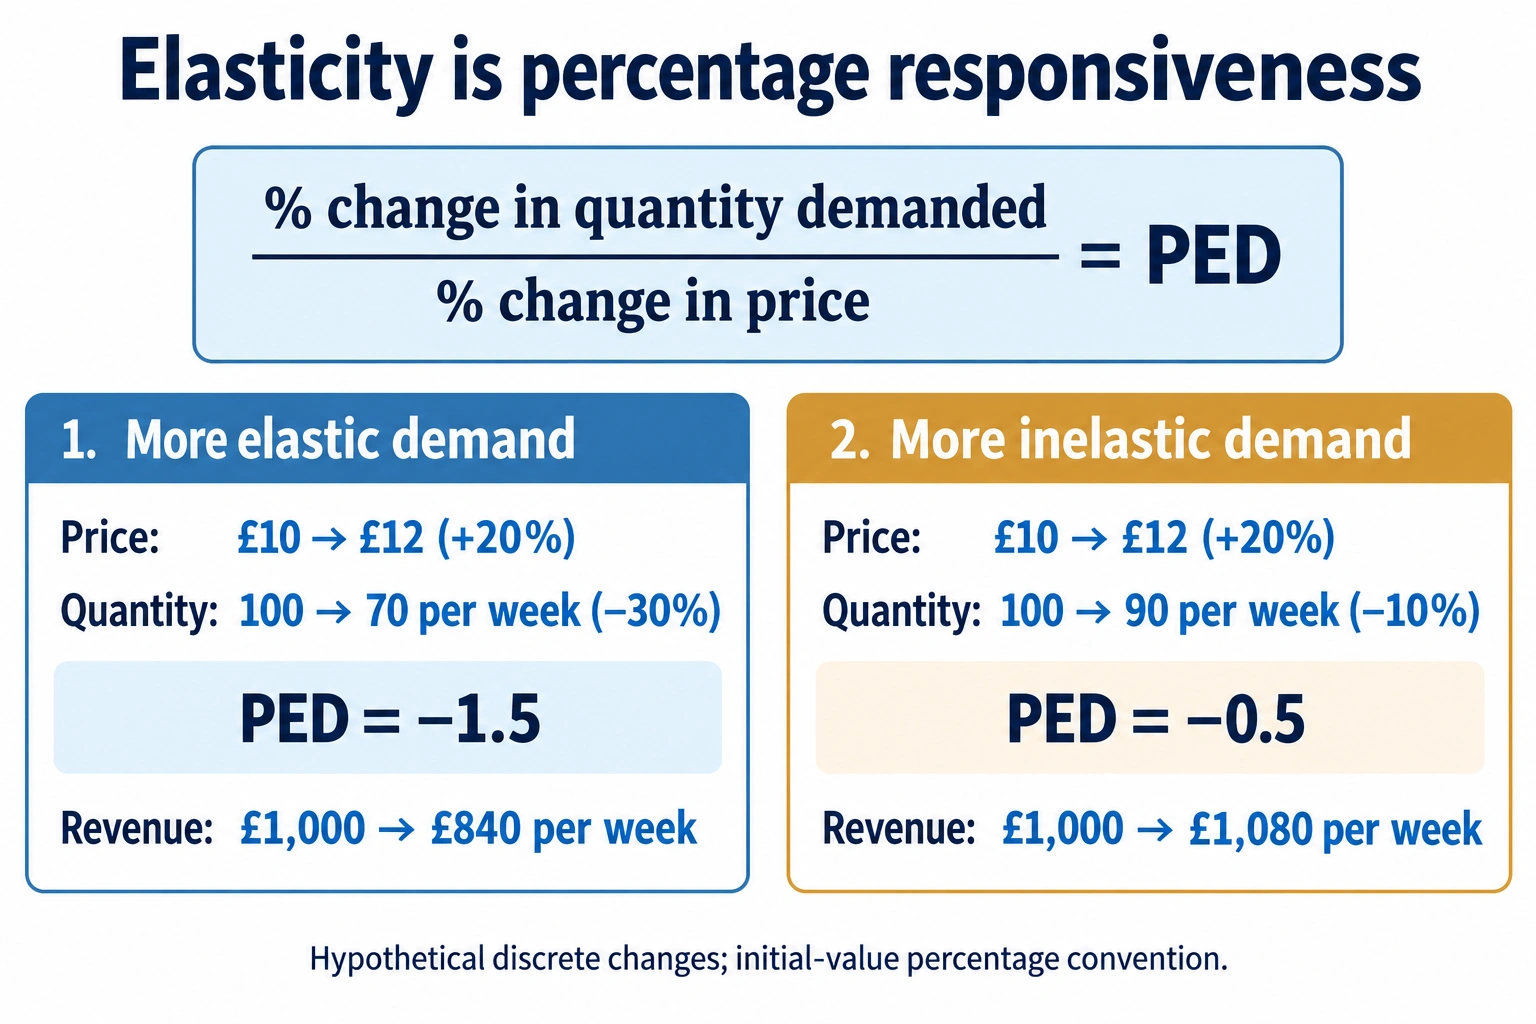
Original teaching plate generated using the built-in imagegen tool, 2026-10-04; conceptual or hypothetical, not empirical evidence. · Original generated artwork; provenance and rights acceptance pending independent review before public publication.
Income and cross-price elasticity: classification with limits
Income elasticity of demand (YED) divides percentage change in quantity demanded by percentage change in income, with own price and other determinants held fixed. A positive value identifies a normal good in the measured range; a negative value identifies an inferior good. A positive value greater than one indicates income-elastic demand, often used to describe a luxury in economic classification. Positive below one means income-inelastic normal demand. These are behavioural responses, not statements that a product is excellent, bad or socially necessary. The same product can change classification across groups or income ranges.
Cross-price elasticity (XED) divides the percentage change in demand for good A by the percentage change in the price of good B. A positive sign is consistent with substitution; a negative sign with complementarity. Preserve the direction: this measures A's response to B's price, not A's own-price response and not necessarily B's response to A's price. Those responses need not have identical magnitudes. A value near zero suggests little measured relationship within this market, period and design, not proof that the goods can never be related.
The PED plate is a reminder that elasticity is a ratio of percentages; its numerical cards specifically concern own price. To use the same structure for YED, replace the denominator with income change; for XED, replace it with the other good's price change. Do not relabel the plate's −1.5 as an income or cross elasticity. Initial-value percentages are used in the examples here. If income changes by £100, that is not a 100% rise unless initial income is £100. Every ratio needs an explicit base, sign, market and time period.
Related-market mechanisms are conditional. Dearer bus tickets may raise bicycle demand when cycling is a feasible substitute, but rail availability, distances and disability access can weaken that response. Dearer printers may reduce cartridge demand, yet long-lived installed printers could keep short-run cartridge use stable. Joint demand is about using goods together, while XED quantifies a particular response. Composite and derived demands involve different links and can produce indirect price effects. Trace the relevant use before interpreting a sign. A surprising estimate should prompt a check of definitions and confounders, not a forced textbook label.
If incomes, own prices and competitor prices change together, an observed demand change does not identify any one elasticity. A recession may alter expectations and credit as well as income. A promotion for good A may coincide with a price rise for B. The supplied exercise isolates one influence by assumption to practise calculation; it does not establish causal coefficients from real transactions. An aggregate estimate can conceal group differences: high-income households may switch products while constrained households reduce consumption. Use a causal design and segmented evidence when a business or policy decision needs a credible forecast.
A forecast also depends on whether responsiveness remains stable outside the observed range. YED can help a firm assess exposure to an income downturn, but product quality, competition and capacity may change. XED can inform substitution claims, but a high value alone does not settle a legal market definition or welfare assessment. Evaluate costs, access and objectives alongside revenue. A strong extended judgement states the tested relationship, applies a numerical response and then explains a realistic limitation or competing mechanism that could alter the decision. It should not merely append "ceteris paribus" as a ritual.
Original model essay — part 1. Replacing every noodle product with meal kits would be an unjustified response to the hypothetical elasticity estimates. A positive income elasticity for meals and a negative estimate for noodles identify conditional demand relationships, not an intrinsic ranking of product quality or a forecast applying to every customer. The retailer needs to consider the income range, customer composition and causes of the observed changes. It also needs a profit comparison: higher demand does not automatically outweigh different purchase costs, waste, storage requirements or competition. Income increases from 2,000 to 2,200 pounds, a 10% change. Meal demand rises from 50 to 60 units, or 20%, giving YED of two. Noodle demand falls from 40 to 38, or 5%, giving YED of minus 0.5. Under the example's assumptions meals are income-elastic normal goods and noodles are inferior goods over this range. Inferior here means that quantity demanded falls as income rises, not that the product is unsafe or undesirable. Another population or income range could produce a different relationship. Customers may continue to value inexpensive or familiar food even when their incomes grow. A downturn is particularly relevant to the proposed complete replacement. If the relationships remain approximately stable, falling incomes would put downward pressure on meal demand while increasing noodle demand. Keeping a range can therefore provide some resilience, although the figures alone cannot establish an optimal mix. Forecasting an exact response to a large fall would require evidence that the local elasticity remains valid across that range. The retailer should compare segment-level income exposure and the profitability of stocking each product, rather than extrapolate a single ratio indefinitely.
Original model essay — part 2. A simultaneous meal advertising campaign could explain part of the observed meal increase. In that case the calculated ratio mixes an income response with a preference or information shift. Evidence from comparable customers without the campaign, together with changes in prices and competing products, would help identify the income mechanism. A persuasive business decision would separate a sustainable shift from a temporary promotional effect and examine whether attracting meal customers merely transfers sales from another product sold by the same retailer. The bicycle transfer makes the aggregation problem clear. Bus fares rise from two to 2.50 pounds, or 25%, while bicycle demand rises from 100 to 110, or 10%, giving XED of 0.4. This is consistent with substitution for some journeys. It does not imply that customers unable to cycle will respond in the same way. If most of the retailer's relevant customers cannot cycle, an aggregate market estimate may be a poor guide to that segment. Under a stable local relationship, a further 10% bus-fare rise suggests a 4% bicycle demand response, but the calculation is conditional rather than a guarantee. I would therefore recommend testing a partial change in the product range while retaining options for different budgets, accompanied by segment-level evidence on demand and margins. This approach has costs and may forgo some gains if meal demand is genuinely strong and stable. Nevertheless, complete replacement requires much stronger evidence than classifying two goods from one hypothetical income change. The best judgement links elasticity to a specified population, causal mechanism and financial objective, while recognising the opportunity cost of narrowing consumer choice.
Worked example: Hypothetical monthly income rises £2,000→£2,200. With prices fixed, meal-kit demand rises 50→60/month and basic-noodle demand falls 40→38/month. Separately, bus fare rises £2→£2.50 with bicycle demand 100→110/week. Compute YEDs and XED.
Income rises 200/2000×100=10%. Meal-kit quantity rises 10/50×100=20%; YED=20/10=2.
Noodle quantity falls 2/40×100=5%; YED=−5/10=−0.5.
Bus fare rises 0.5/2×100=25%; bicycle quantity rises 10/100×100=10%; XED=10/25=0.4.
Meal kits are income-elastic normal demand in this range; noodles are inferior in this range; bicycles and bus trips are consistent with substitutes for the specified consumers.
If the bus fare rises another 10% and XED stays 0.4, a local approximation predicts 4% more bicycle demand; stability and other determinants must be stated.
Answer: YED meal kits +2; YED noodles −0.5; bicycle response to bus fare XED +0.4. These unit-free classifications apply to the isolated hypothetical changes, not every buyer or a whole lifetime.
Check your understanding: Write 450–600 words advising a firm that plans to replace all basic noodles with meal kits because YED is higher. Use calculations, assess a downturn and identify an alternative explanation for the measured changes. Transfer: explain how the firm should interpret XED when most customers cannot cycle.
Answer: A 10% income rise is associated under the assumptions with 20% more meal kits and 5% fewer noodles. High YED creates upside during income growth but exposure during contraction; inferior demand could provide a buffer, though coefficients need not be symmetric or stable. Margins, capacity, quality and customer composition affect the replacement decision. A meal-kit advertising campaign or own-price cut could confound a purported income response. XED +0.4 is an aggregate relationship for a specified group; it may poorly predict a group unable to cycle. Retain product diversity or test a smaller change unless credible segment-level evidence and profitability support full replacement. Another judgement is acceptable if the same risks are weighed.
Why: Indicative criteria: correct bases and signs; accurate normal/inferior and substitute interpretation; explicitly distinguish YED/XED from PED; apply the downturn and mobility constraint; explain a confounder rather than list one; weigh costs and uncertainty in a conditional recommendation. No claim that an inferior good is low-quality should substitute for economic classification.