GDP and living standards: nominal, real, per head and PPP
By UK A Level Economics · independent study · myAudience
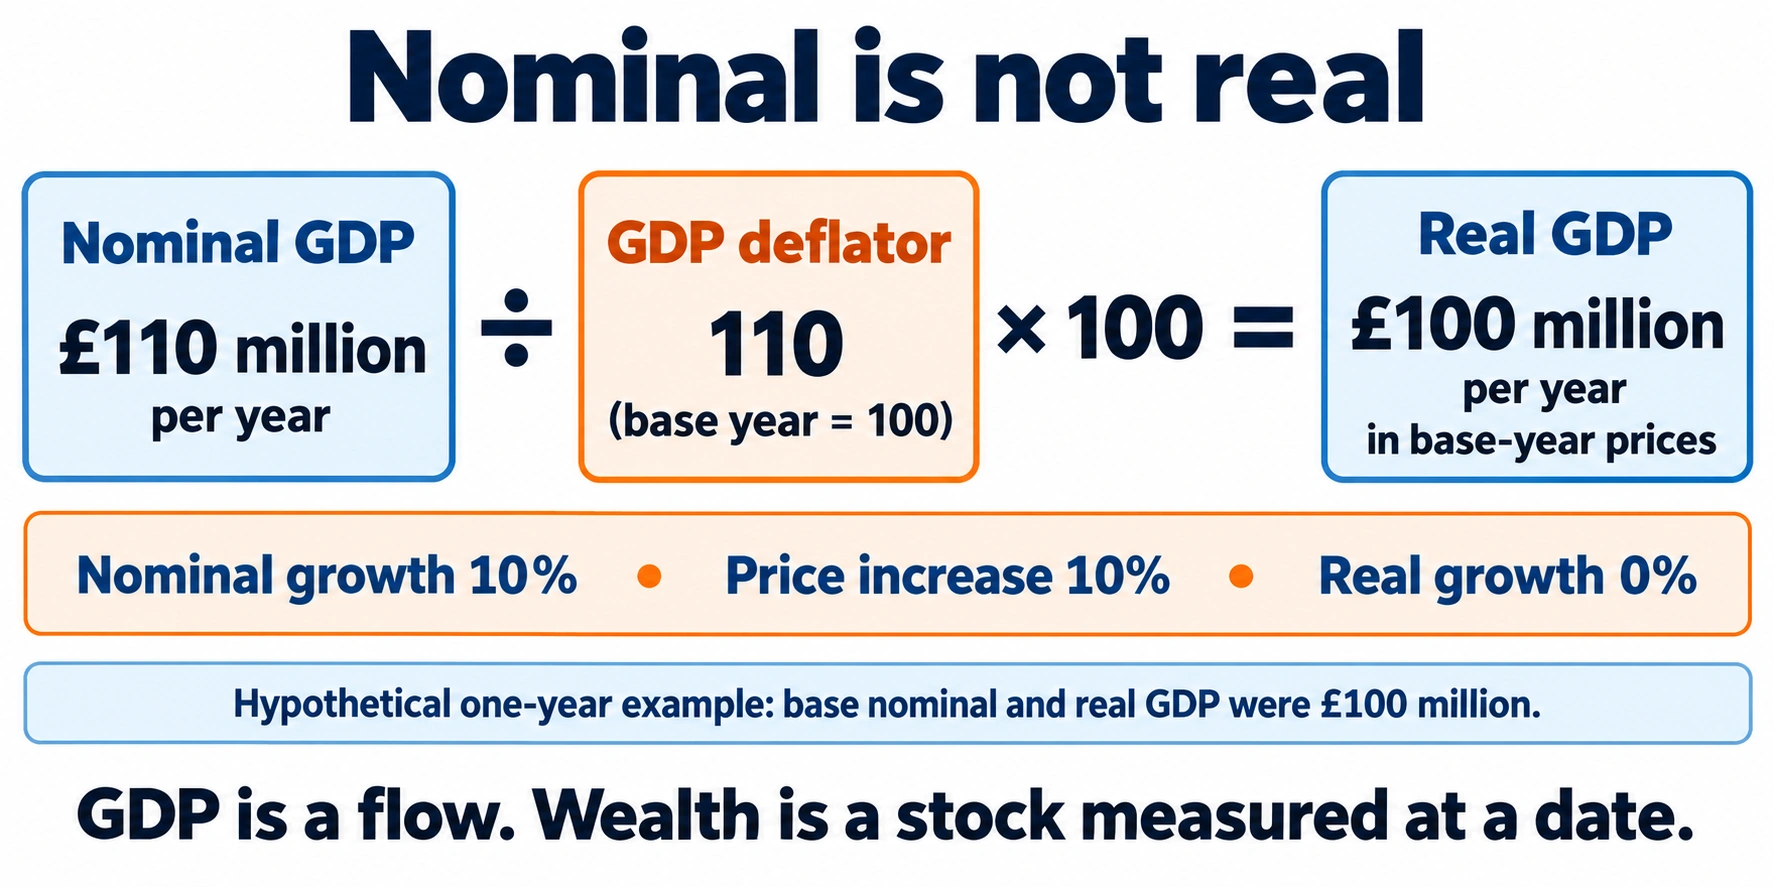
Original teaching plate generated using the built-in imagegen tool, 2026-10-04; conceptual or hypothetical, not empirical evidence. · Original generated artwork; provenance and rights acceptance pending independent review before public publication.
GDP and living standards: nominal, real, per head and PPP
GDP measures production within an economy over a period. It is a flow, such as £million per year, not the economy's accumulated wealth on a date. Value added avoids double counting intermediate products: counting wheat, flour and bread at their full sale values would count some production more than once. The output, income and expenditure approaches describe the same production through different accounting perspectives, subject in practice to measurement discrepancies and revisions. Buying an existing financial asset is not new production just because money changes hands. Saving is not the same as producing new physical investment.
Nominal GDP values output at the prices of the period. A nominal rise can reflect prices, quantities or both. Real GDP attempts to remove price changes. In a simple fixed-base classroom calculation, real=nominal/deflator×100, where the deflator is an index with base 100. The plate shows nominal £110 million/year with deflator 110 giving real £100 million in base-year prices. ONS uses chain-linked volume measures in actual national accounts, so the single-base example is a transparent simplification rather than the detailed production method. A consumer price index is not automatically the appropriate GDP deflator: their coverage differs.
The exact growth relationship is (1+nominal growth)=(1+real growth)(1+deflator growth). Subtracting inflation from nominal growth is an approximation for small rates, not a generally exact calculation. If nominal GDP rises 10% while the deflator rises 10%, real GDP is unchanged, not growing. If population grows while real GDP stays fixed, real GDP per person falls. GDP per head is an average and can rise while many households' incomes fall. Distinguish total productive activity, average available output and the distribution of purchasing power.
GDP is useful evidence about market production and can inform resource and employment analysis, but it is not a complete welfare score. Unpaid care, leisure, pollution, distribution, insecurity and product quality may be inadequately represented. Repair after a disaster can increase measured production while welfare remains lower. Real output growth may improve living standards when it expands useful resources, but this inference needs evidence about who benefits and what costs are incurred. Do not claim a fall in GDP necessarily means every household is worse off, or a rise that every person gains.
International comparisons add exchange rates and prices. Converting nominal incomes at market exchange rates can distort comparisons of what local income buys when price levels differ. Purchasing power parity (PPP) uses a comparison of purchasing power across currencies; it can improve a volume comparison but still depends on representative baskets and comparable quality. Different countries' needs, public services and inequality remain relevant. The numerical currency example below is invented and labelled; it is not a PPP estimate for any country. National-income comparisons require matched periods, population measures and definitions.
Link a macro measure back to micro choices. More investment may raise future capacity, but it uses current resources and may fail; higher healthcare output may reflect either improved access or greater illness. A statistic identifies an accounting change without by itself explaining its cause or value. A good extended response performs the real/per-head calculation, identifies the comparator, offers a competing explanation and chooses supplementary indicators. Evidence about median household real income, health, leisure and environmental effects can alter a welfare judgement. This first measurement lesson does not teach AD/AS, monetary transmission or the full national accounts.
Original model essay — part 1. A 21% increase in nominal GDP does not establish a 21% improvement in living standards. GDP measures a flow of production valued over a period, while living standards also depend on prices, population, distribution, leisure, environmental conditions and other outcomes. Nominal growth combines changes in quantities and prices. A defensible comparison must first use a suitable price adjustment and a consistent population measure, then ask how well the resulting average describes people's circumstances. Calling GDP useful does not require treating it as a complete welfare measure. In the hypothetical example, nominal GDP rises from 100 million to 121 million while the matching deflator rises from 100 to 110. Dividing 121 by 110 and multiplying by 100 gives real GDP of 110 million. Real output therefore grows by 10%, not 21%. Subtracting the ten-percent price increase from 21% would give 11%, but that shortcut is not exact for these finite changes. The correct ratio is 1.21 divided by 1.10, minus one. Using the consumer price index without justification would introduce another error because its basket need not match the composition of GDP. Population rises from one million to 1.1 million. Real GDP per person is consequently 100 in both periods under the stated units: 100 million divided by one million initially and 110 million divided by 1.1 million later. The real output increase is exactly matched by population growth in this example. That does not mean every person's circumstances are unchanged. Income distribution, household composition and access to public services can change while the average remains constant. A rising mean could likewise coexist with falling resources for a substantial group.
Original model essay — part 2. International comparisons add a separate valuation problem. A hypothetical 600 units of local income convert to 60 pounds at ten local units per pound, but to 120 at a purchasing-power conversion of five. The difference reflects alternative conversion assumptions, not an automatic doubling of physical output. Purchasing-power comparisons can better reflect domestic purchasing capacity, yet depend on basket comparability, quality and aggregation. Neither a market exchange rate nor a classroom PPP ratio should be advertised as a complete measure of each country's welfare or of every household's purchasing power. Reconstruction after destruction is an especially revealing transfer. Repair work can increase recorded production even though buildings and other assets have been lost. GDP is a flow, not the value of the surviving wealth stock. Additional repair output may restore some welfare while the community remains worse off than before the disaster. A claim that increased GDP proves the event beneficial ignores the counterfactual production that would otherwise have occurred, lost assets and human consequences. It also mistakes spending on remedial activity for the harm being undone in full. I would report real GDP per head alongside distributional evidence, employment and hours, service outcomes and relevant environmental or wealth indicators. Such a dashboard introduces choices about measurement and weighting, so it is not a value-free solution. Nevertheless, it makes the judgement's dimensions explicit. Real GDP remains informative about production capacity and resources available for choices; in the example it supports a ten-percent aggregate quantity increase but no per-person increase. The 21% nominal figure alone cannot sustain the claimed welfare conclusion.
Worked example: Hypothetical economy: year 0 nominal GDP £100m, deflator 100, population 1m. Year 1 nominal GDP £121m, deflator 110, population 1.1m. Calculate real GDP and per-head growth. Separately country B has income 600 local units/head; market rate 10 units/£ and PPP rate 5 units/£.
Year 0 real GDP=100/100×100=£100m. Year 1=121/110×100=£110m in base-year prices.
Real total growth=(110−100)/100×100=10%. Nominal growth=21%, deflator growth=10%; 1.21/1.10−1=0.10 exactly.
Per-head output year 0=£100m/1m=£100; year 1=£110m/1.1m=£100. Per-head growth is zero.
Country B market conversion=600/10=£60/head; PPP conversion=600/5=£120/head in comparable purchasing-power units.
The PPP calculation improves the price-level comparison under its assumptions but does not establish distribution, public-service quality or wellbeing.
Answer: Real GDP rises £100m→£110m (10%), while real GDP/head remains £100 (0%). B converts to £60 at market rates versus £120 at the hypothetical PPP rate. All numbers are original teaching examples.
Check your understanding: Write 500–650 words evaluating "Nominal GDP grew 21%, proving living standards rose by 21%." Use both calculations, distinguish flow/stock and average/distribution, and propose a small indicator dashboard. Transfer: reconstruction raises output while homes and wealth remain damaged.
Answer: The price-adjusted total rise is 10%, not 21%; population growth leaves real output per head unchanged. Even per-head growth would not establish each household's gain because distribution and omitted welfare effects matter. GDP is a production flow; destroyed homes reduce a wealth stock, and rebuilding can add to GDP while people remain worse off than before the disaster. International market conversion can mislead purchasing-power comparisons, but PPP is also incomplete. Add median real disposable income, employment/underemployment, health/leisure and environmental indicators, with matched definitions and dated sources. Conclude that production increased in real aggregate terms under the example, while the living-standard claim is unsupported.
Why: Indicative criteria: exact deflation and per-head denominators; avoid subtracting 10 from 21 as the exact real rate; distinguish flow from stock and market FX from PPP; connect disaster/distribution to welfare limits; propose indicators tied to the question; make a bounded evidence-based judgement. Another welfare conclusion requires additional supplied evidence, not a guess from nominal GDP.