Crime evidence: what surveys and police records actually measure
By UK GCSE Sociology · independent study · myAudience
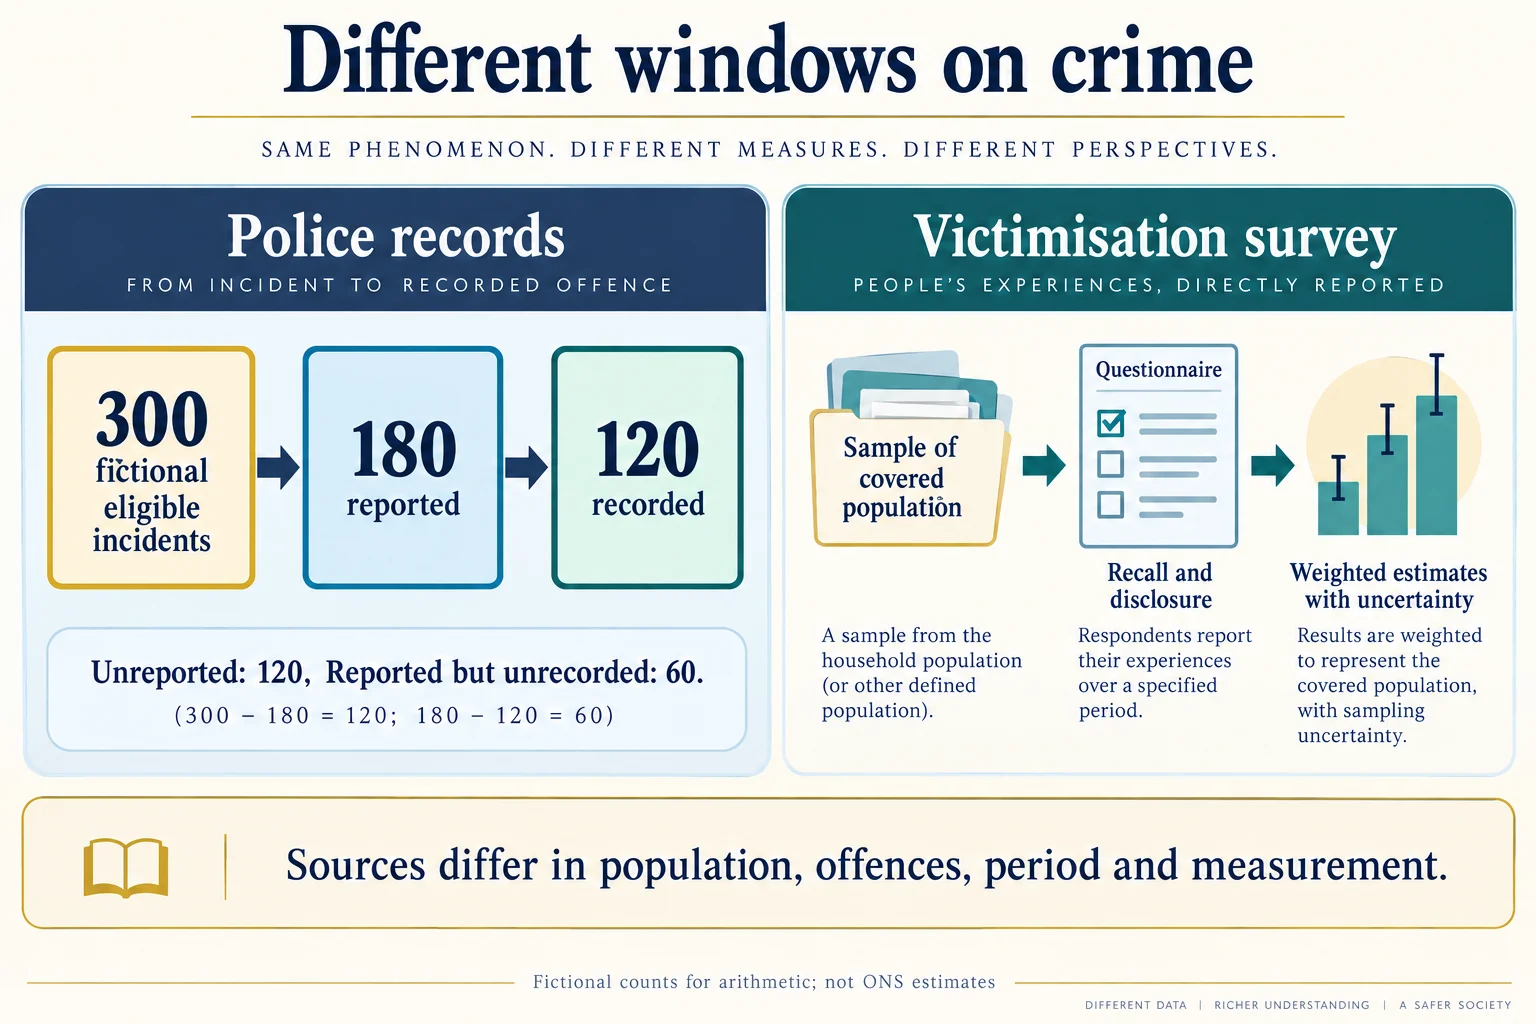
Original built-in OpenAI imagegen teaching illustration, generated 4 October 2026; conceptual model, not documentary evidence. · Original generated illustration; no third-party artwork intentionally reproduced.
Crime evidence: what surveys and police records actually measure
Crime statistics answer questions about events or experiences captured by specified measurement processes. An incident count, a victim count and a victimisation proportion are not interchangeable. A person can experience more than one incident, while one incident can affect more than one person. Every interpretation therefore needs its unit, population, offence definition, period and source. A headline about all crime cannot be justified by a series covering only selected offences and populations. The question is not which source is always right, but which source is suitable for a defined comparison and what remains outside its coverage.
The diagram uses an original fictional counting model:300 eligible incidents,180 reported and 120 recorded. It stipulates that every recorded incident is among those reported, and every reported incident is among those eligible. On those assumptions,120 incidents were unreported and 60 were reported but unrecorded. The combined 180 absent from the records are not a separate 180 incidents to add to the original 300. These are constructed counts for arithmetic, not estimates of hidden crime in England and Wales. Real systems have classification, timing and linkage problems, so this neat nested model must not be assumed without evidence.
A victimisation survey provides a different window. It samples a defined population and asks about experiences within a reference period, including some not reported to police. Respondents may forget, interpret questions differently or choose not to disclose. Weighting can address aspects of the sample design and population composition without making every omitted experience visible. A survey is not simply the unrecorded remainder of a police count, and its estimated incidents should not be added to recorded incidents as if the sources were disjoint. Conversely, administrative records can provide detail about recorded events that a general sample cannot capture precisely.
The actual ONS quality report, revised 23 July 2026, defines the relevant geography as England and Wales. It describes the CSEW's covered household population aged 16 and over, asking about experiences in the 12 months before interview, and exclusions, including businesses, people outside households and some offence types. It distinguishes accredited survey estimates from police recorded figures whose wider recording accreditation was removed. The provisional response rate for the year ending March 2026 was 48%; this is a response-rate measure, not a crime rate. These source boundaries guide criticism. Neither a lower response rate alone nor official status alone establishes that an estimate is biased, unbiased or complete.
Use a fixed dated release rather than an unspecified latest figure. The ONS 23 July 2026 bulletin, corrected 13 August 2026, reports approximately 9.6 million CSEW headline incidents for the year ending March 2026 versus 9.4 million for the preceding survey year, with no statistically significant change. Those rounded estimates do not establish an increase in all crime. The correction concerns harassment estimates, and not every separately collected experience belongs within headline crime. The bulletin and its correction date must remain attached to any classroom comparison. Later releases may revise the picture; this reading is not a live dashboard.
A numerical difference can be real in the arithmetic without supporting a confident population change. Using the published rounded totals,0.2/9.4 is approximately 2.1%, but the calculation inherits rounding and does not replace uncertainty analysis. No statistically significant change means the stated evidence does not establish a change at the report's criterion; it does not prove the population totals were exactly identical. A complete interval calculation requires the relevant uncertainty inputs, which are not supplied here. Comparable estimates, offence coverage and reference periods must be established before interpreting a line chart, and its axis must not imply precision absent from the data. In the actual ONS Figure 1, two lines distinguish inclusion and exclusion of fraud and computer misuse. Comparing the earlier dark line with the later light line changes offence coverage, not just time.
Perspectives guide further questions rather than determine a statistic's truth by label. A functionalist interpretation may examine rules and institutions that organise recording; a feminist interpretation may ask which experiences and disclosures existing instruments overlook; a Marxist interpretation may examine unequal power in defining, reporting and pursuing offences. Each needs an explicit measurement or institutional mechanism. Under-recording does not by itself quantify discriminatory treatment, and a victimisation survey does not resolve every concern about unequal voice. Seek independent evidence, contrary cases and appropriate methods for the particular offence and population rather than treat every discrepancy as proof of one perspective.
The image separates sources and labels its counting model fictional. Its unscaled survey bars and whiskers illustrate estimation and uncertainty; they supply no measured ONS values. Learners should explain where the tidy diagram would fail in a real comparison. No sensitive personal investigation is proposed, and no identity, neighbourhood or country is characterised as inherently dangerous. The extended model below combines arithmetic with source critique and a conditional judgment. Actual historical trend depth, more offence-specific evidence and contemporary debates remain open; reading this lesson does not close the full crime topic or certify mastery.
Original extended model response, part 1:
The fictional record series and the dated survey estimates answer different questions, so neither should be used to announce a change in all crime without qualification. In the constructed diagram,120 of 300 eligible incidents are recorded. That is 40%, while 180 incidents are absent from the record set:120 unreported and 60 reported but unrecorded. These calculations follow the stipulated nested sets. They are not estimates of England and Wales's hidden crime, and the survey estimates cannot be added to the 120 as if they represented a separate set of events.
The dated survey comparison also requires care. The rounded headline estimates differ by about 0.2 million, or approximately 2.1% relative to the earlier total. That arithmetic is descriptive and approximate. The official report states that the change is not statistically significant, so a claim that a population rise has been established is stronger than the evidence. Equally, saying that nothing changed would confuse insufficient evidence for a change with proof of exact equality.
Original extended model response, part 2:
Before selecting a source, I would define the outcome. A question about victimisation among covered household residents is different from a question about offences recorded by police, demand on investigators or experiences excluded from the headline measure. Their populations, offence categories and reference periods need checking. An incident total is also not the percentage of people victimised, because repeat experiences can affect the relationship between those quantities. The actual source chart separates series including and excluding fraud and computer misuse. I would compare within a consistently defined series, checking its different starting period and missing survey years, rather than treat the vertical gap between differently covered lines as a sudden increase.
Different theoretical perspectives can identify measurement questions. A feminist account could investigate whether a method supports disclosure of particular experiences; a Marxist account could ask whether resources affect reporting or institutional response; a functionalist account could consider consistency of recording procedures. None is confirmed solely by the existence of missing incidents. Relevant instruments, administrative practices and ethically obtained accounts would be needed, without requesting sensitive disclosures from classmates.
My judgment is that the survey and records should be used as complementary, bounded sources rather than competitors for one universal truth. The constructed flow explains a possible recording gap, while the real dated comparison illustrates uncertainty. A justified report states geography, period, units and exclusions; preserves the correction notice; and says which additional evidence would change its interpretation. It cannot infer individual risk, causal explanations or the full scale of all crime from these two comparisons alone.
Worked example: Under the fictional nested model,300 incidents are eligible,180 reported and 120 recorded. Calculate recorded share, reported-but-unrecorded share of reports, total absent from records and its share of eligible incidents. Explain why adding a separate survey estimate to the records would usually be invalid.
Recorded share:120/300=40%.
Reported but unrecorded:180-120=60;60/180=one third, approximately 33.3% of reports.
Absent from records:300-120=180;180/300=60%. This equals 120 unreported plus 60 reported but unrecorded.
A survey may include recorded incidents and use different populations, offences and periods; it is not stipulated to count a disjoint remainder.
Answer: The model gives 40% recorded, approximately 33.3% of reported incidents unrecorded, and 180 incidents or 60% of eligible incidents absent from records. All figures depend on the fictional nesting assumption. Adding survey and record totals could double-count overlapping experiences while combining incompatible coverage. Neither these shares nor the invented 300 establish a real dark figure, a cause of reporting behaviour or an individual's likelihood of victimisation.
Check your understanding: Write 300–450 words evaluating the claim that rising recorded counts or slightly different survey estimates necessarily establish an increase in all crime. Use the fictional model and dated source comparison, address uncertainty and coverage, apply two perspectives through measurement mechanisms, and justify an evidence plan. Indicative learning rubric:16 points—units/calculation 4, source comparison 4, uncertainty and mechanisms 5, conclusion 3.
Answer: The extended original model is one defensible response. It preserves the fictional nesting, distinguishes record counts from survey estimates and population change, and gives a conditional source-specific conclusion. An alternative answer can prioritise a different appropriate source when its outcome, offence and population are explicitly defined.
Why: Credit acknowledging that rounding and uncertainty limit conclusions, and that different sources can overlap while omitting different experiences. Do not credit equating non-significance with proof of no change, response rate with victimisation rate, every record with every crime, or source disagreement with a demonstrated causal theory. Indicative points support learning and are not an official mark scheme or guarantee of a grade.