A mean can conceal the distribution
By UK GCSE Psychology · independent study · myAudience
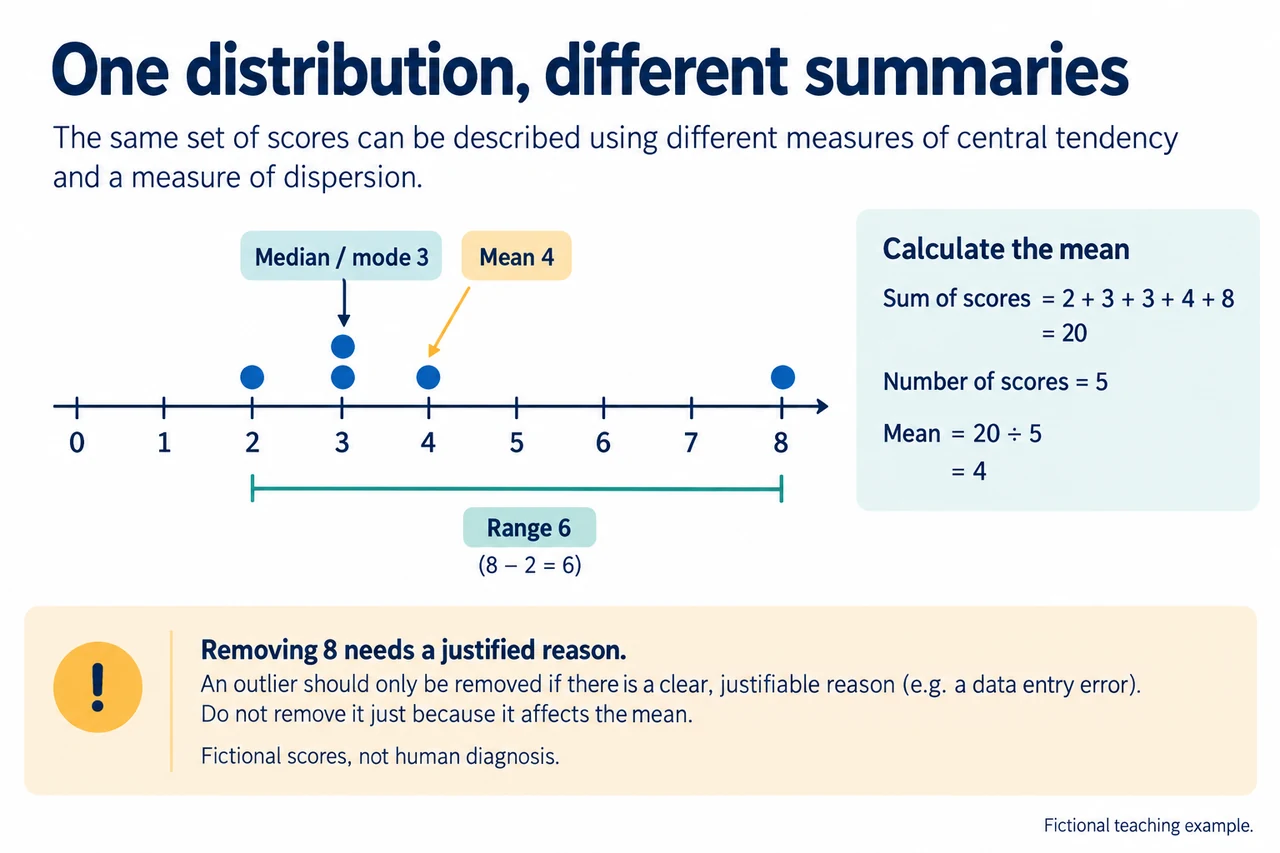
myAudience original generated educational concept illustration; fictional examples. Image: illustration, not a documentary photograph. · Original myAudience illustration; no affiliation or endorsement by an awarding body.
A mean can conceal the distribution
A summary statistic compresses a distribution; it does not replace it. The mean uses every value, the median locates the middle ordered observation and the mode identifies the most frequent value. The range describes the distance between the largest and smallest observations. These answer different questions, so disagreement between them is not automatically a calculation error. Our five fictional scores, 2, 3, 3, 4 and 8, illustrate how a high observation affects some summaries more than others without telling a story about any real person.
For the mean, add all five scores: 2 + 3 + 3 + 4 + 8 = 20. Divide by the number of observations, not the number of distinct values: 20 / 5 = 4. A frequency table would record two observations at three and one each at two, four and eight; multiplying values by frequencies yields the same sum. Counting each distinct value once would lose an observation and change the question. The mean is in the score’s unit, not in people or percentages unless that is the original measurement.
The scores are already ordered. With five observations, the third is the middle, so the median is three. Three occurs twice and every other score once, making three the sole mode. For an even number of numerical observations, the median is normally the mean of the two central values; that extra rule is not needed here. The range is 8 − 2 = 6, not the number of observations and not eight. State the endpoints when checking it: a range alone does not show where the scores sit.
The eight pulls the mean above the cluster around three because its contribution to the sum is relatively large. The median depends on order position, so it is less sensitive to this single high value. Neither becomes the “true average” for every purpose. If the question asks about the total distributed across all five observations, the mean is useful. If it asks for the centre of this skewed small set, the median communicates a typical middle position while a plot retains the unusual high score.
Deleting eight produces the set 2, 3, 3, 4: its sum is twelve and its mean is 12 / 4 = 3. This is a sensitivity comparison, not permission to discard inconvenient data. A documented recording error or a pre-specified justified exclusion can warrant correction or removal; an accurate high observation remains evidence even when it changes the story. Explain the rule, its reason and its effect transparently. With only five observations, dropping one removes twenty percent of the sample and materially changes what is summarised.
The illustration places exactly five dots on an equally spaced zero-to-eight number line, with two stacked at three. The mean label points to four and the median/mode label to three; the range bracket runs from two to eight. Four happens to be an observed score here, but a mean need not be one. This dot plot exposes information that the summaries hide, including the gap before eight. It is not a diagnosis, a normal-distribution claim or an empirical result. Whole-number arithmetic needs no spurious extra decimal places.
Evaluated model response to the transfer: I would report the median of three as a useful description of the middle of these five ordered fictional scores, alongside the full distribution and range of six. The mean is four because the sum is twenty divided by five, and the mode is three because that value occurs twice. The high score of eight raises the mean; that is a property of using every magnitude rather than evidence that the calculation is wrong. If the purpose were accounting for the total across observations, the mean would still be appropriate. The purpose of the summary should therefore be stated.
Removing eight changes the mean to three, but I would not remove it simply to make the average look more typical. A legitimate exclusion would need a documented reason, such as a verified entry error or an independently justified rule, applied transparently rather than selected after seeing the desired result. I would show the effect of that decision and retain the original evidence where appropriate. Neither a median nor a range gives the complete pattern, and a five-score example cannot establish a population distribution or a cause. My conclusion would compare the summaries with their purpose and limitations instead of treating one average as universally correct.
Worked example: For fictional scores 2, 3, 3, 4, 8, calculate mean, median, mode, range and the mean if 8 is removed; assess whether removal is justified.
Sum 2+3+3+4+8=20; mean 20/5=4.
The third ordered observation is 3: median 3.
Three appears twice: mode 3.
Range=8−2=6.
Removing 8 gives sum 12 andn 4: mean 3.
An exclusion needs a documented independent reason, not preference for the changed mean.
Answer: Mean 4, median 3, mode 3, range 6; excluding 8 changesmean to 3 but is not justified merely by its influence.
Check your understanding: Justify a measure of centre for 2, 3, 3, 4, 8, compare all four summaries, assess exclusion of 8 and explain what the summaries cannot establish.
Answer: Mean 4, median 3, mode 3, range 6; meanwithout 8=3. Choose centre by question, preserve distribution, and require independent justification for exclusion. Neither summary proves population distribution or causation. Full 150–300-word response is in the final two paragraphs.
Why: Reward correct denominators, ordered median, retained duplicate 3, distinct typical-value and total purposes, and transparentlimits.