What does a serial-position curve support?
By UK GCSE Psychology · independent study · myAudience
myAudience original generated educational concept illustration; fictional examples. Image: illustration, not a documentary photograph. · Original myAudience illustration; no affiliation or endorsement by an awarding body.
What does a serial-position curve support?
The multi-store model offers a proposed organisation of memory rather than a photograph of mental storage. Sensory, short-term and long-term stores have different roles, and their coding, capacity and duration are separate properties. Capacity concerns how much can be retained under stated conditions; duration concerns how long; coding concerns the form of representation. A serial-position result concerns recall across positions in a presented list. It cannot, on its own, measure every property of each proposed store.
Primacy describes relatively good recall for early list positions; recency describes relatively good recall for late ones. Within a simplified store account, earlier items may benefit from more rehearsal and longer-term retention, while recent items remain particularly accessible at immediate recall. These are explanations offered for a pattern, not definitions that guarantee its cause. Attention, interference and output order also affect recall. A predicted pattern becomes more informative when conditions vary in ways that competing explanations treat differently.
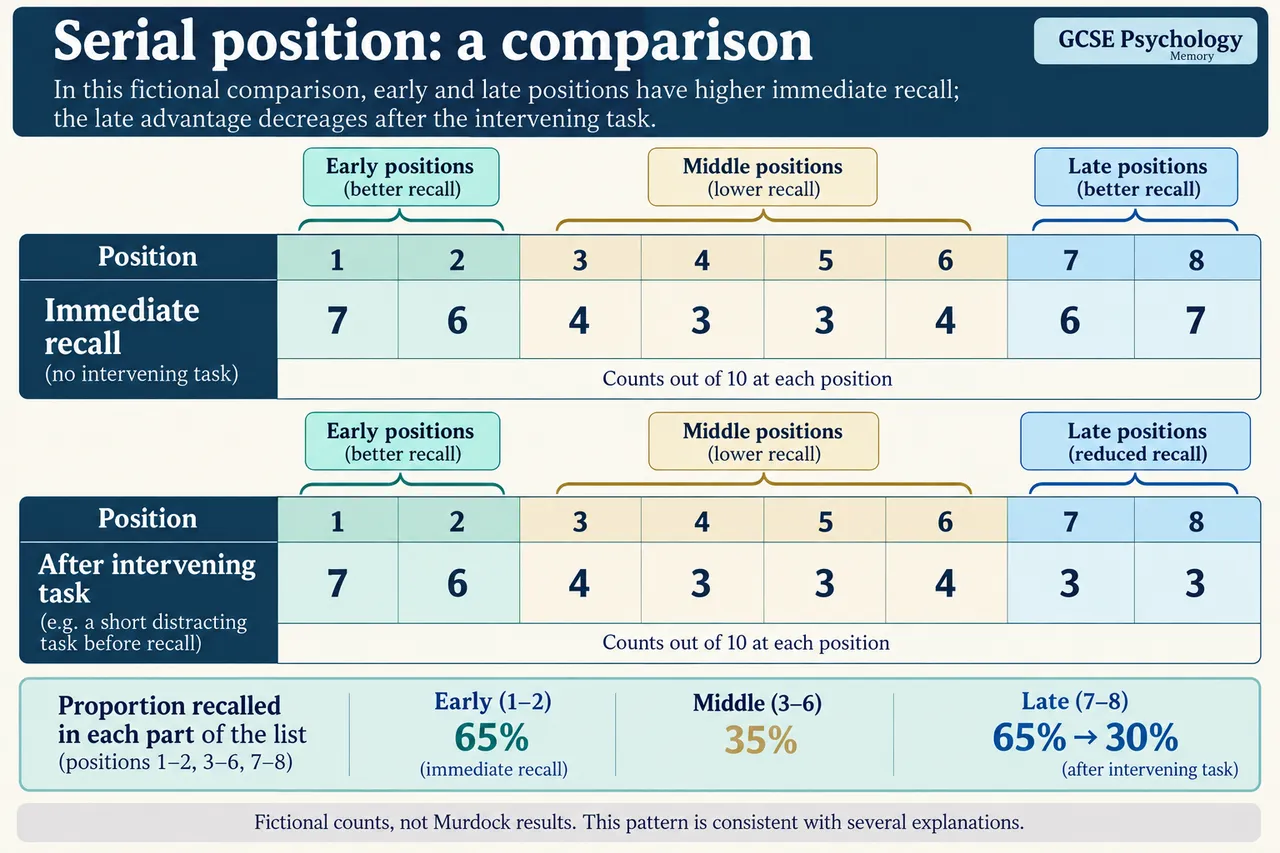
Our immediate fictional counts across eight positions are 7, 6, 4, 3, 3, 4, 6 and 7 out of ten presentations at each position. They correspond to 70%, 60%, 40%, 30%, 30%, 40%, 60% and 70%. Averaging the first two positions gives 65%; the middle four give 35%; the last two give 65%. The denominator is ten for each position, not eight, which is the number of positions. These invented values are not Murdock's published observations.
After a stipulated intervening task, the fictional counts become 7, 6, 4, 3, 3, 4, 3 and 3. Early and middle averages remain 65% and 35%, while the late average is 30%. The late change is minus 35 percentage points, not minus 35 percent of its earlier value. This selective difference is consistent with disruption of recent accessibility under a store explanation. It is not automatically evidence of statistical significance: sample structure, uncertainty and actual individual responses are absent.
An alternative could emphasise interference from the intervening activity or a change in retrieval context. Rehearsal and recall order may also contribute to early and late advantages. A conceptual comparison would therefore hold presentation rate, materials and scoring constant while distinguishing a delay alone from a delay containing a task. Predictions should be stated before interpreting outcomes. This does not instruct readers to test themselves or other people. Real ethical practical performance remains a separate qualification requirement, not completed by studying synthetic tables.
prescribes Murdock's serial-position study. Detailed published sample, procedure and findings require reading the relevant original evidence; our source gate does not substitute a metadata record for that work. The present plate is explicitly a fictional comparison with exact counts and denominators. It demonstrates how to interpret a pattern and a model prediction, not an empirical replication or anatomical localisation. Broader store coding, capacity and duration evidence and independently assessed transfer remain open even after these explanations are read.
Full evaluated model. The immediate fictional averages are 65% for positions one and two, 35% for positions three through six, and 65% for positions seven and eight. Following the intervening task they are 65%, 35% and 30%. Thus the late average declines by 35 percentage points while the stipulated early and middle averages remain unchanged. A simplified multi-store interpretation is that recent items were especially accessible at immediate recall and that the intervening activity disrupted this availability, while earlier items benefited from rehearsal and more lasting retention. The pattern is consistent with that prediction; it does not prove the theory merely because it can be described using its terms.
Interference or changed retrieval context could also make recent items less accessible. Differences in presentation rate, word familiarity or recall order would offer further rivals if they were not controlled. A useful conceptual comparison would distinguish an equally long delay without a task from one with an intervening task and retain common materials, instructions and scoring. Different predictions across those conditions would help evaluate competing accounts, although they would not erase every confound. These are invented counts without individual observations or uncertainty estimates, so an inferential significance claim is unavailable. The figures also do not show anatomical compartments or measure all store properties. Murdock's prescribed study needs its own verified evidence, rather than having this synthetic eight-position table attributed to it. The justified conclusion is a conditional model-compatible pattern with unresolved process and generalisation limits.
Worked example: Calculate early, middle and late averages for eight-position fictional counts, out of 10 per position: immediate 7, 6, 4, 3, 3, 4, 6, 7; after task 7, 6, 4, 3, 3, 4, 3, 3.
Immediate early=(7+6)/20×100=65%.
Immediate middle=(4+3+3+4)/40×100=35%.
Immediate late=(6+7)/20×100=65%.
After task early and middle remain 65% and 35%; late=(3+3)/20×100=30%.
Late change=30−65=−35 percentage points.
Do not infer significance, anatomical compartments or Murdock empirical data from this synthetic table.
Answer: The fictional late advantage decreases by 35 percentage points; competing process accounts remain possible.
Check your understanding: The synthetic immediate counts are7,6,4,3,3,4,6,7 out of10 at positions1–8. After a matched intervening task, counts are7,6,4,3,3,4,3,3 out of10. Calculate early/middle/late averages, explain a multi-store prediction and one alternative, and explain why this does not prove anatomical stores.
Answer: The last two teaching paragraphs provide the full evaluated original model response; the worked example supplies the exact numerical/classification steps.
Why: Immediate65/35/65%; intervening65/35/30%; late change−35 percentage points Recent-access disruption fits store account conditionally Interference/rehearsal/context and output-order alternatives Synthetic, tiny matched fictional sample; no inferential significance