Costs and revenue: build a model with units and limits
By UK GCSE Business · independent study · myAudience
Original myAudience educational illustration. Image: illustration, not a documentary photograph. · myAudience educational illustration; no affiliation with any awarding body.
Costs and revenue: build a model with units and limits
Revenue is price multiplied by quantity sold. Fixed costs do not change with output within a stated period and relevant range; variable costs change as output changes. Total variable cost equals variable cost per unit multiplied by output, and total cost adds fixed cost. “Fixed” does not mean forever unchanged: rent can rise, and another site can add a step in costs. Wage classification depends on the payment arrangement. A monthly salary may be fixed over a range, while payment per item is variable. State units so £4 per unit is never accidentally added directly to £1,200 per month.
The image table gives checkpoints for a hypothetical constant price of £10 and variable cost of £4 per unit with £1,200 fixed cost. On the corresponding linear graph, revenue starts at zero because nothing is sold at zero output; total cost starts at £1,200 because fixed costs remain. The model slopes mean revenue grows £10 per unit while total cost grows £4. The vertical gap gives profit or loss, not cash in the bank. The model assumes output equals sales, constant prices and unit costs, no capacity steps and the same accounting period. Unsold inventory, discounts and overtime can break those assumptions.
Models make consequences visible but do not supply demand. Cutting price increases revenue only if the resulting volume is sufficient; a percentage cut in price and the same percentage rise in quantity do not cancel. Contribution per unit is price minus variable cost, available to cover fixed cost and then profit. Contribution is not final profit. Transfer criterion: calculate a full revenue/cost comparison, state assumptions, test a changed input, and explain which business evidence is needed before using the result to decide.
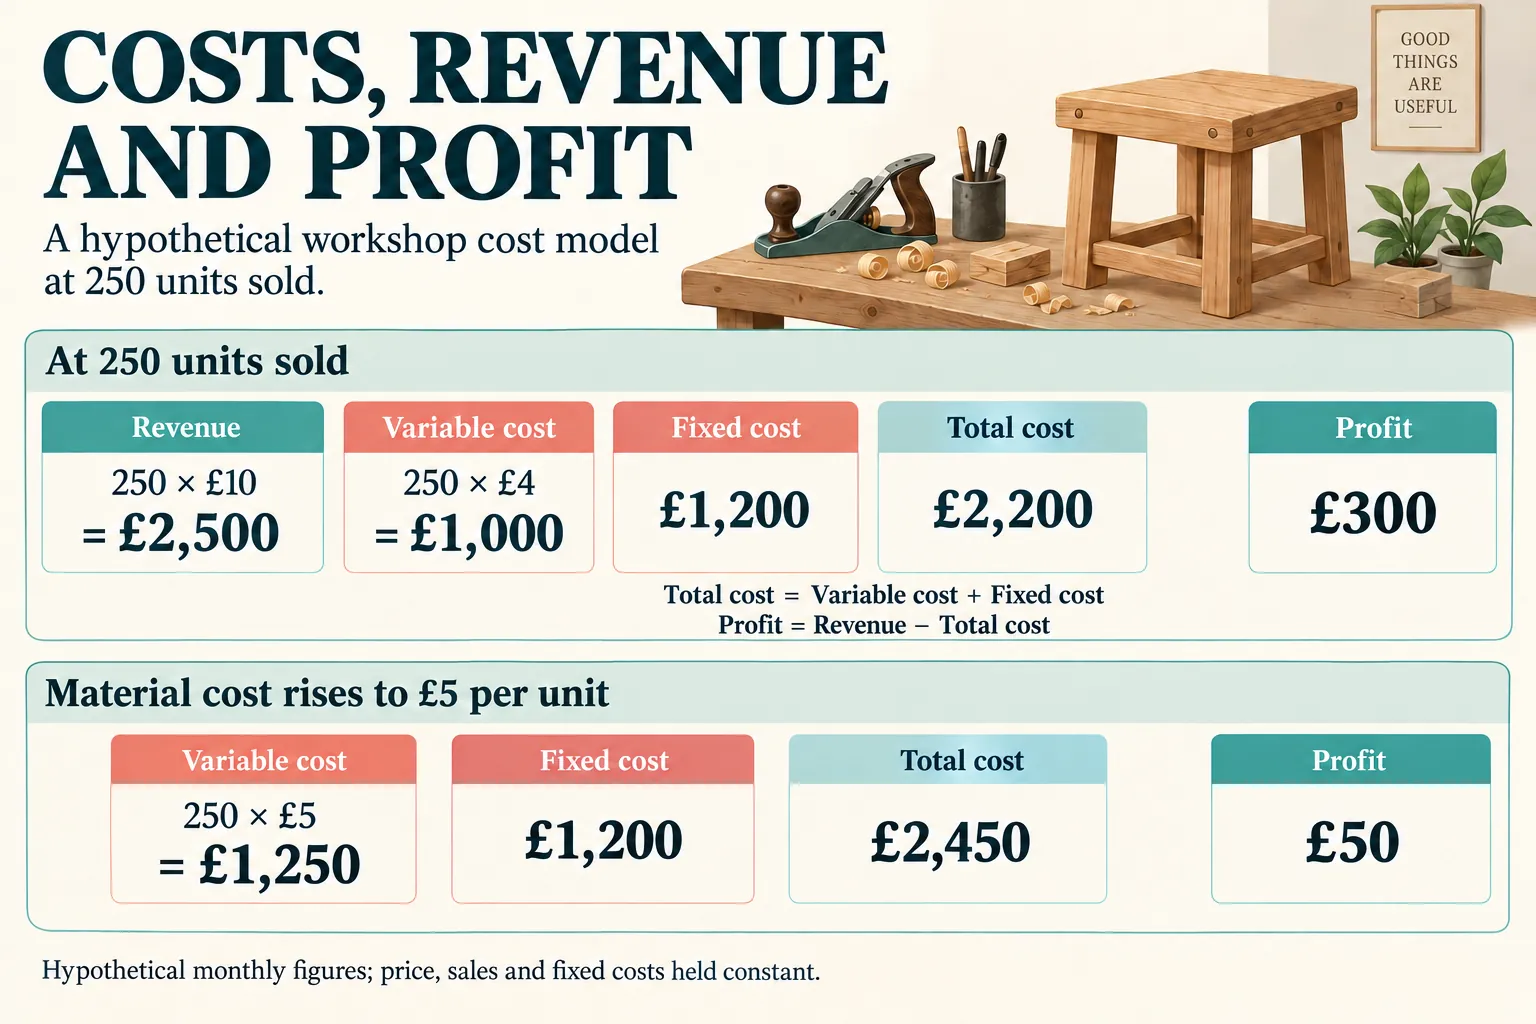
A cost classification describes how a cost changes with activity within the model's relevant range. Fixed does not mean permanent or unavoidable: taking a larger workshop can change the fixed-cost total. Variable cost per unit can also change with waste, discounts or overtime. Keep the period and output definition consistent. Multiplying monthly fixed costs by units would count them repeatedly; omitting them would mistake contribution for profit. In the illustration, compare the two rows at the same 250 sales: the fixed-cost card is unchanged while material cost removes £250 from profit. The cards are not scaled areas; read the explicit equations.
Contribution is the amount each sale leaves after its variable cost to cover fixed costs and then profit. In the original promotion, the lower price removes £1 of contribution from every sale, including sales that would have happened anyway. Extra volume must compensate for this loss. The forecast is a condition, not a result: disappointing demand can make an apparently successful revenue increase less profitable.
An operational response should trace a cause, not merely name a strategy. Reducing rejected material can reduce effective cost per sale without lowering specifications; cutting inspection could instead increase faults, refunds and harm. A price trial needs evidence of customer response and competitor alternatives. Compare the changed contribution with any implementation cost, then examine cash and service consequences before treating the calculation as a recommendation.
Evaluated model for the original material-cost question. At the stipulated 250 sales, revenue is 250 × £10 = £2,500. The new variable cost is 250 × £5 = £1,250. Adding the unchanged monthly fixed cost of £1,200 gives total cost of £2,450 and profit of £50. The earlier £300 profit therefore falls by £250. This is not a forecast of changing demand: it is the result if price, volume and fixed costs remain as stated. The increase removes £1 from the contribution on each of 250 sales, which explains the whole reduction. My initial recommendation is to investigate avoidable material waste before imposing a general price increase. If usable output can be maintained with fewer rejects, the workshop might recover some contribution while preserving the product customers expect. However, waste reduction is not a free or certain saving. Better training or a revised process may cost money, and some material loss may be necessary for quality. I would ask for actual reject rates and the cost of the proposed change rather than assuming the full £1 increase can be removed.
A carefully tested price change is another possibility, but the question gives no evidence that customers will accept it. At £11 and unchanged volume and costs, profit would return to £300; that conditional calculation is useful, but cannot justify forecasting £300. Customers could choose substitutes, lowering sales and leaving fewer contributions to cover fixed costs. A limited, transparent trial could provide evidence of willingness to pay and whether customers value the workshop's quality. Changing supplier could also reduce costs, but a cheaper quotation may mean poorer material, unreliable delivery or different ethical conditions. Those disadvantages could create refunds, delays or reputational damage greater than the saving. I would protect safe working and required product standards, compare waste-reduction costs with evidenced price responses, and keep a cash reserve while testing. If records show negligible avoidable waste and customers reliably accept a modest price increase, the recommendation could change towards pricing. Without that evidence, the £50 calculation signals a narrow cushion and the need for a controlled response, not permission to assume demand or sacrifice quality.
Worked example: Hypothetical monthly model: price £10, variable cost £4 per item, fixed cost £1,200, 250 items produced and sold. A promotion cuts price to £9 and forecasts 300 sold, within capacity. Compare.
Base revenue = 250 × £10 = £2,500; variable cost = 250 × £4 = £1,000; total cost = £2,200; profit = £300.
Promotion revenue = 300 × £9 = £2,700; variable cost = £1,200; total cost = £2,400; profit = £300.
Revenue rises £200, but the extra variable costs also rise £200, leaving profit unchanged.
Contribution falls from £6 to £5 per unit. If only 280 sell at £9, profit = £2,520 − (£1,200 + £1,120) = £200. Demand uncertainty matters.
Answer: The forecast promotion increases volume and revenue but not profit; lower-than-forecast volume reduces profit.
Check your understanding: Hypothetical material cost rises from £4 to £5 per unit at 250 sales and £10 price. Calculate profit and recommend a response without assuming demand will tolerate a price rise.
Answer: Revenue £2,500; variable cost £1,250; total cost £2,450; profit £50. Investigate waste reduction or a tested price change while protecting quality and safe working conditions. Do not assume a cheaper supplier offers equivalent quality.
Why: The £250 cost increase passes directly into profit under the fixed-volume assumptions. A stronger answer distinguishes a calculation from a forecast and develops a credible operational or marketing response with evidence and a downside.