Profit and margins: compare performance on a fair basis
By UK GCSE Business · independent study · myAudience
Original myAudience educational illustration. Image: illustration, not a documentary photograph. · myAudience educational illustration; no affiliation with any awarding body.
Profit and margins: compare performance on a fair basis
Profit is revenue less the relevant costs over a period; a negative result is a loss. In a simplified income statement, gross profit is revenue less cost of sales, and net profit subtracts other expenses from gross profit. Cost of sales is the cost attributable to goods or services sold, not every cash payment made. State what the question includes rather than adding unstated tax or depreciation. Buying machinery is a cash outflow; it is not automatically an expense of the same amount in that period. Full accounting treatment is outside this first model.
Gross profit margin = gross profit ÷ revenue × 100; net profit margin = net profit ÷ revenue × 100. Both compare profit with sales revenue, not with cost or invested capital. A 20% net margin means 20p net profit per £1 of revenue under the stated accounting definitions. Mark-up instead compares profit addition with cost and gives a different percentage. Zero revenue makes a margin undefined. A corresponding graph’s vertical gap is an amount of profit; a margin scales that amount by revenue, allowing a more useful comparison between differently sized businesses.
An income statement measures activity over a period. A statement of financial position is a snapshot of assets and liabilities at a date: assets are resources owned and liabilities are obligations owed. Neither statement alone proves liquidity, worker wellbeing or customer satisfaction. Compare like periods and definitions, trends and appropriate competitors, then consider stakeholder perspectives. Transfer criterion: calculate margins with the right denominator, distinguish percentage points from percentages, and explain one plausible mechanism and one missing piece of evidence behind a change.
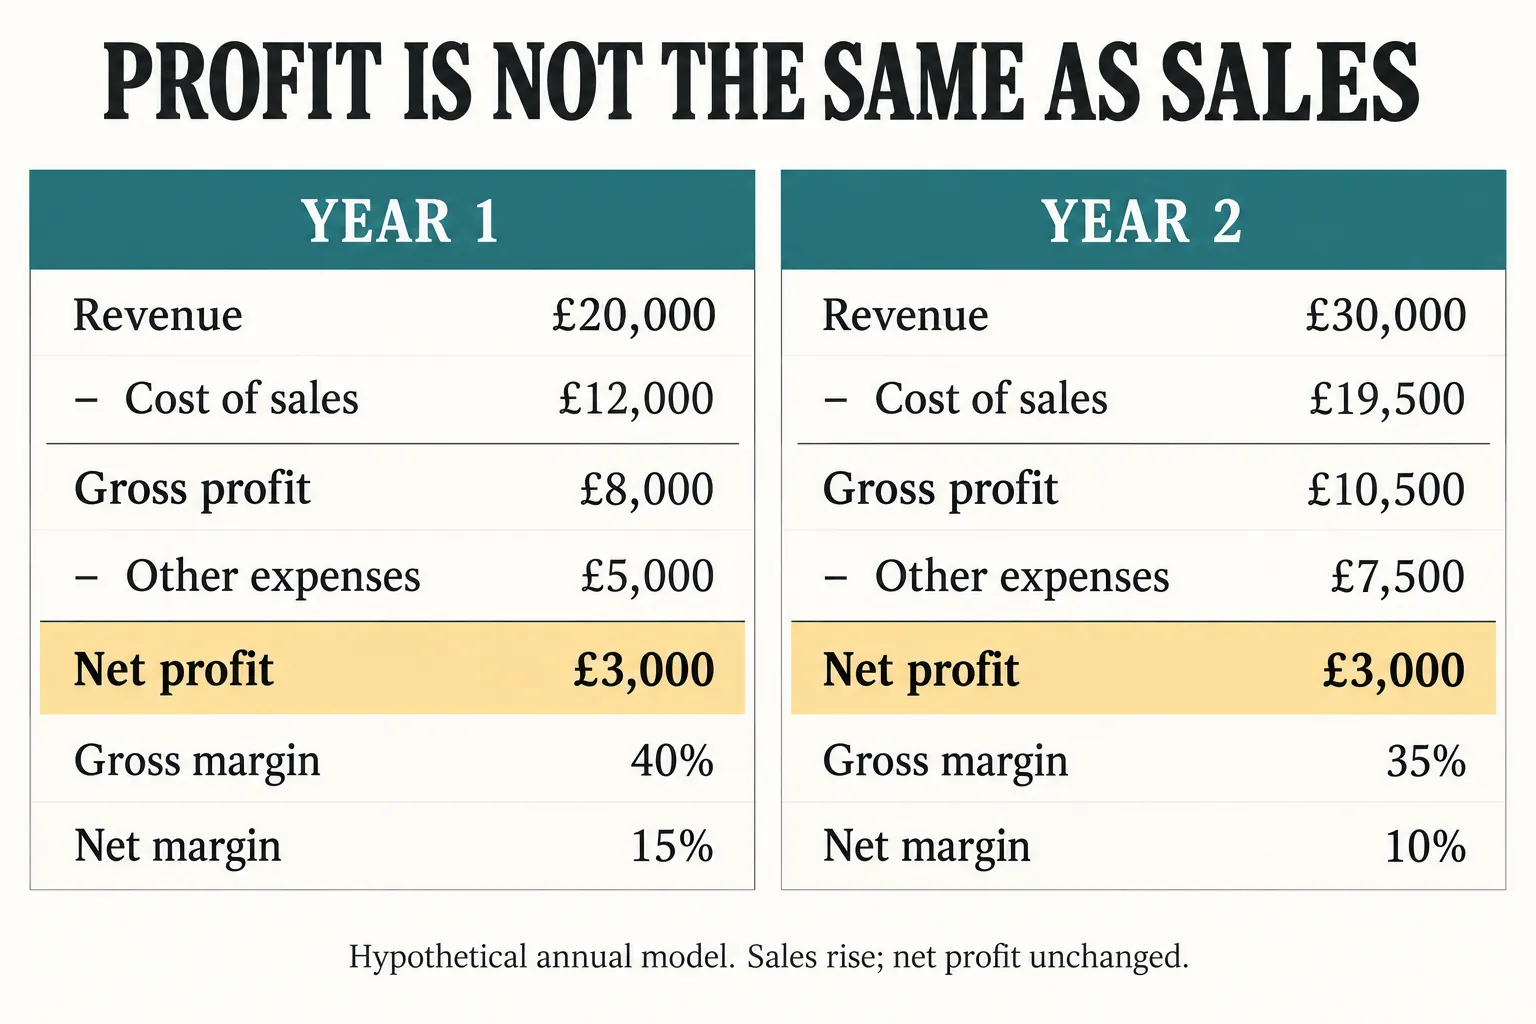
A margin is a ratio, so its denominator matters as much as its numerator. A £2 gross profit on a £10 selling price is 20% of revenue, while the same £2 is 25% of the £8 cost. The two percentages answer different questions; neither should be silently substituted into a comparison. State the accounting boundary before calculating: a contribution calculation deducts variable cost, whereas gross profit deducts the specified cost of sales. In the illustration, follow the same subtraction rows in both years: gross profit grows, but the larger expenses leave net profit unchanged. Read the separate margin rows as ratios, not money.
The original two-year comparison shows why growth alone is inconclusive. Year 2 earns a larger gross profit in pounds, yet a smaller share of each sales pound remains. Other expenses then absorb the increase, leaving net profit unchanged. A lower margin may reflect a deliberate expansion strategy rather than simple inefficiency, but that explanation needs evidence. Price changes, sales mix and supplier costs can produce similar ratios through different mechanisms.
Profitability and liquidity are separate questions. A sale can enter the period's revenue before the customer pays, and investment or loan repayment can consume cash without being the same period's trading expense. A financial statement is evidence with a defined purpose, not a complete verdict on the enterprise. Combine consistent statements with due dates, operational quality and stakeholder effects; do not infer those missing facts from a favourable percentage.
Evaluated model for the original margin and mark-up question. The item sells for £10 and has a stipulated cost of £8, leaving £2 gross profit. Gross margin uses sales revenue as its denominator, so £2 ÷ £10 × 100 = 20%. Mark-up compares the profit addition with cost, giving £2 ÷ £8 × 100 = 25%. There is no contradiction: the same addition is being measured against two different bases. Calling the 25% figure a margin would overstate the share of revenue retained as gross profit. Under these stated unit definitions, each pound of revenue leaves 20 p after the relevant cost of sales. That is a useful indicator of unit trading performance, but it is not evidence of a 20 p net profit. The enterprise still has other expenses, and the question gives neither their total nor the number of items sold. Even accurate unit calculations cannot establish the outcome over a whole month or year without that information. I would therefore report both percentages with their names and denominators, while refusing to describe the whole business as profitable on this evidence alone.
For example, as a separate illustrative extension, selling 100 identical items would generate £1,000 revenue, £800 cost of sales and £200 gross profit. If other expenses for the same period were £250, net profit would be a £50 loss. The example is not additional data from the question; it demonstrates how a positive unit margin can coexist with a period loss. Conversely, selling enough units to cover those expenses could produce net profit, so the conclusion should not be that the product necessarily fails. I would request total sales, a consistent cost-of-sales definition and the period's other expenses, then calculate net profit and net margin. I would also examine whether sales were collected in cash and when bills fall due, because even positive net profit would not settle liquidity. Comparison with previous periods or competitors would require matching definitions and relevant business differences. A lower margin might support greater volume or a service objective, while a higher margin at tiny volume could leave overheads uncovered. The justified conclusion is therefore limited but clear: 20% margin and 25% mark-up are correct unit measures; total activity and expenses determine net profitability, and cash timing needs a separate assessment.
Worked example: Hypothetical year 1: revenue £20,000, cost of sales £12,000, other expenses £5,000. Year 2: revenue £30,000, cost of sales £19,500, other expenses £7,500. Evaluate profit growth and margins.
Year 1 gross profit £8,000 and net profit £3,000; gross margin 40%, net margin 15%.
Year 2 gross profit £10,500 and net profit £3,000; gross margin 35%, net margin 10%.
Revenue grew 50%, but net profit was unchanged. Net margin fell 5 percentage points, not merely 5%.
Higher cost of sales relative to revenue could reflect material prices or discounts; these are hypotheses. Check data and cash obligations before judging performance.
Answer: Sales and gross profit rose, but unchanged net profit and lower margins weaken the claim that expansion improved profitability.
Check your understanding: A hypothetical item costs £8 and sells for £10. Calculate its gross margin and mark-up, then explain why neither proves the whole business earns a net profit.
Answer: Gross profit £2; gross margin 2 ÷ 10 × 100 = 20%; mark-up 2 ÷ 8 × 100 = 25%. Other expenses can absorb gross profit, so total sales and all relevant expenses are needed.
Why: The same £2 has different comparison bases. Transfer answers explain the denominator and connect unit economics to the whole period. A high margin at tiny sales can coexist with a net loss, and even a net profit does not establish adequate cash to pay bills.