Break-even charts: interpret thresholds and challenge assumptions
By UK GCSE Business · independent study · myAudience
Original myAudience educational illustration. Image: illustration, not a documentary photograph. · myAudience educational illustration; no affiliation with any awarding body.
Break-even charts: interpret thresholds and challenge assumptions
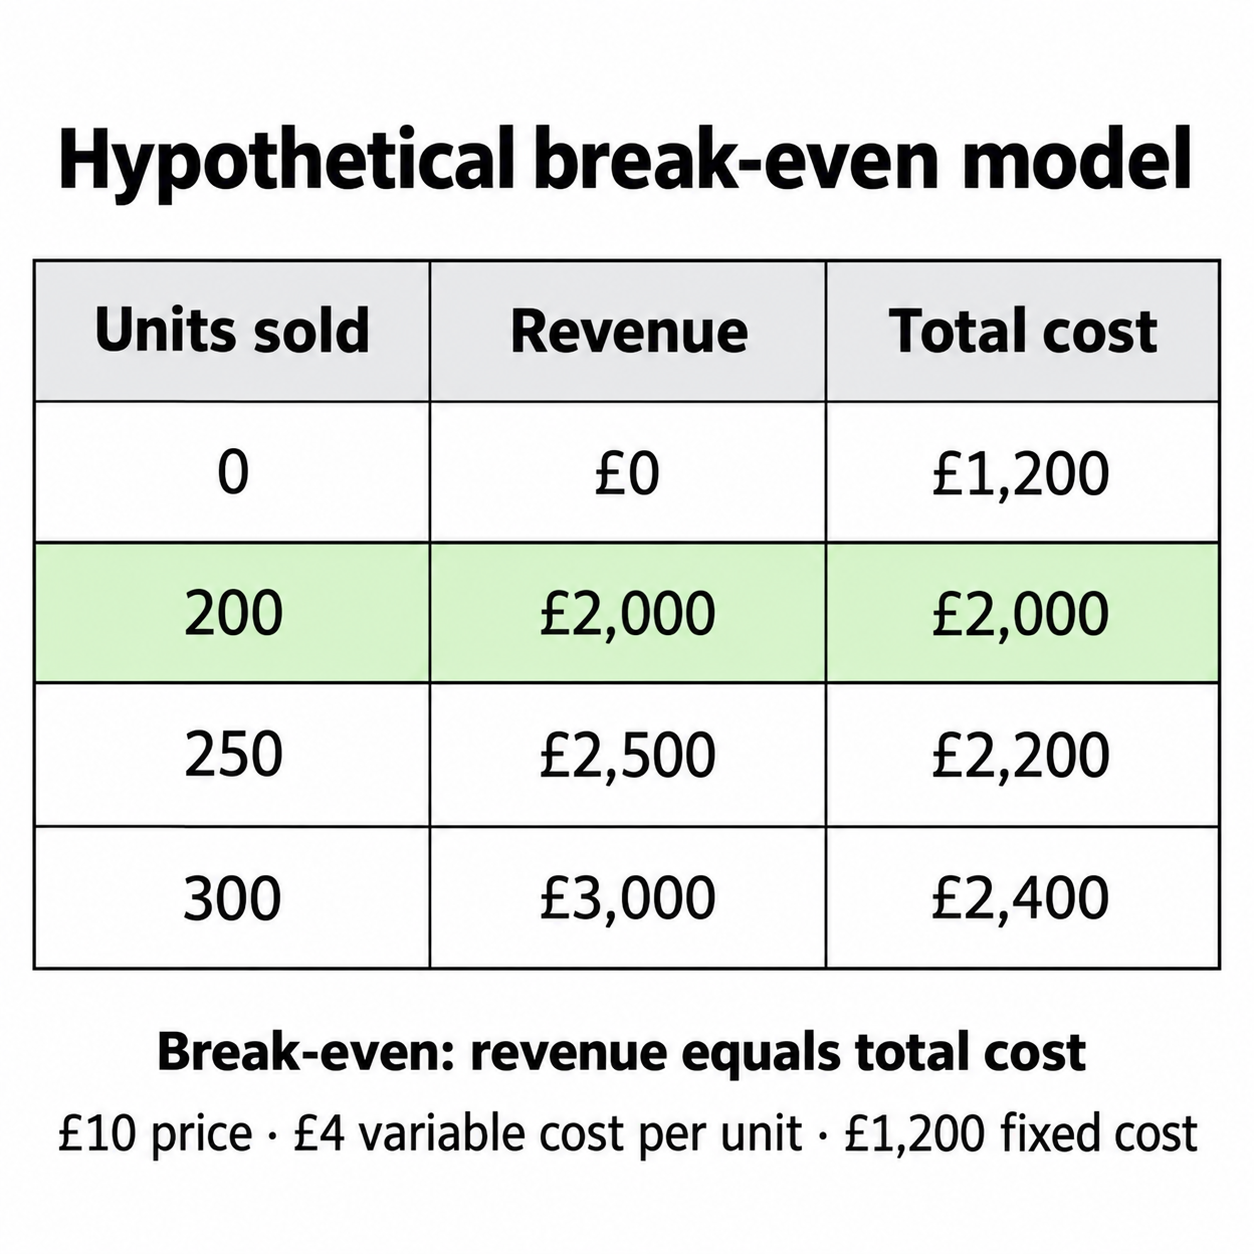
Break-even output is where total revenue equals total cost, producing neither profit nor loss in the stated model. Read the intersection of the two lines, then project down to the output axis. The image table supplies exact checkpoints for this linear model: its corresponding graph would intersect at 200 units at £2,000. Below it, cost exceeds revenue; above it, revenue exceeds cost. Fixed cost remains even at zero sales. Margin of safety is actual or expected sales minus break-even sales in units. It describes how far sales can fall before the model reaches loss; it is not money available in the bank.
This specification assesses interpretation of break-even charts, including margin of safety and the value of analysis. Drawing charts and using the formula are not expected. The following algebra is a labelled extension to explain the graph: profit = (price − variable cost per unit) × quantity − fixed cost. Setting it to zero gives fixed cost ÷ contribution per unit when contribution is positive. If price equals variable cost and fixed cost is positive, no finite volume breaks even. If contribution is negative, producing more makes the loss worse; dividing mechanically would create a misleading negative output.
The analysis helps compare prices and cost structures but rests on linear costs, constant price, sales equal to output and sufficient demand and capacity. A chart cannot tell us whether buyers will purchase 200 units, whether cash arrives on time or whether production is safe. Step costs and unsold stock change the model. Transfer criterion: read the threshold with units, quantify margin of safety, evaluate one changed assumption and use qualitative evidence to decide. Do not treat a large projected margin as guaranteed examination performance or guaranteed commercial success.
On a linear break-even chart, read the horizontal output coordinate where total revenue and total cost meet, then check the vertical money coordinate. Below that output, the cost line lies above revenue; above it, the relationship reverses in this model. The vertical separation is profit or loss at the selected output. The horizontal distance from break-even to forecast sales is the margin of safety, measured in units rather than pounds. The retained illustration is a numerical checkpoint table: it verifies the stated values but does not by itself teach reading axes or projecting an intersection. Those chart-reading assessed tasks remain open for a separate accurately reviewed chart.
The chart assumes a constant selling price and variable cost per unit, fixed costs within the relevant range, and that the model's output is sold. Capacity or unsold stock can break that interpretation. A forecast is not guaranteed demand. Algebra can explain the supplied chart as an extension, but current specifies interpreting break-even charts and margins of safety without requiring learners to draw the chart or use a break-even formula.
A capacity ceiling can make the current plan infeasible even if a threshold is numerically correct. Expanding capacity may raise fixed costs and move the threshold, while discounting to sell more can reduce contribution. Read any revised chart with the revised assumptions rather than carry across the old intersection. Financial viability must also respect quality, working conditions and a feasible cash schedule; a profitable model is not a licence to exceed safe limits.
Evaluated model for the original capacity question. Simply selling more does not solve the stated problem. The hypothetical chart places break-even at 320 units, but safe capacity is only 280 units. The threshold exceeds the operating limit by 40 units, so the current price and cost model cannot reach break-even within that limit. Demand above 280 would not remove the constraint, and treating unsafe extra output as an available option would ignore the premise. Nor does the question supply price and cost values from which an exact profit at 280 can be calculated. The justified conclusion is that revenue and cost do not meet within safe capacity under the stated model, not an invented loss figure. One possible response is a price change that increases contribution per sale. However, customers may buy less or switch to substitutes, so raising price cannot be assumed to bring a viable result. Market evidence and a revised chart would be needed. Reducing variable waste or fixed costs could lower the threshold, but savings must be attainable without weakening quality, safety or the enterprise's ability to operate.
A funded capacity change is another possibility, yet it must be evaluated as a new model. Additional equipment, space or staffing can increase fixed costs, meaning the old 320-unit break-even point may no longer apply. The workshop needs evidence of sufficient demand, a reliable operational increase and finance for both investment and working cash before committing. The separate original example illustrates sensitivity: with £10 price, £4 unit cost and £1,200 fixed costs, break-even is 200 units and 250 forecast sales leave a 50-unit margin. Raising unit cost to £5 moves the threshold to 240 and cuts that margin to ten; a small change can therefore remove much of the cushion. Those figures do not replace the task's 320 and 280, but show why each proposed intervention must be recalculated. My recommendation is to reject 'sell more' as a solution within the present safe limit and investigate an evidenced price or cost adjustment first, alongside a carefully financed capacity option. If no revised model reaches profitability at achievable demand and safe output, the plan should be redesigned or paused. Evidence of reliable additional demand and a capacity investment that remains profitable after all new costs could reverse that judgement. The answer is conditional because the chart is a decision aid with assumptions, not a guarantee of sales, cash availability or acceptable working conditions.
Worked example: Use the hypothetical image table and its corresponding linear chart: £10 price, £4 variable cost, £1,200 fixed cost. Forecast 250 sales, capacity 270. What does the chart imply, and how does £5 variable cost alter the decision?
The equal-value table row identifies the corresponding graph’s intersection at 200 units and £2,000; at 250 units revenue £2,500 exceeds cost £2,200 by £300.
Margin of safety = 250 − 200 = 50 units. Optional percentage extension = 50 ÷ 250 × 100 = 20%.
Extension algebra at £5 variable cost gives £1,200 ÷ (£10 − £5) = 240 units; at 250 sales profit £50 and margin of safety 10 units.
Capacity exceeds both thresholds, but demand uncertainty and quality are material. A forecast of 230 sales at the new cost yields £1,150 contribution − £1,200 = −£50 loss.
Answer: Base forecast is profitable with a 50-unit margin; the cost rise narrows it to 10 units and makes a small demand miss dangerous.
Check your understanding: A hypothetical chart predicts break-even at 320 units, but safe capacity is 280. Recommend whether simply selling more solves the problem.
Answer: The stated operating model cannot reach break-even within safe capacity. Investigate pricing, fixed costs, unit cost or a funded capacity change; do not exceed safe limits or assume demand. Retest after any change because capacity expansion may add fixed costs.
Why: Read the model against a real constraint. Algebra alone can generate a number that cannot be delivered. The strongest decision links finance, demand and operations and says what evidence would make a different operating model viable.