3. Energy, precipitation and the meaning of a climate baseline
By UK A Level Geography · independent study · myAudience
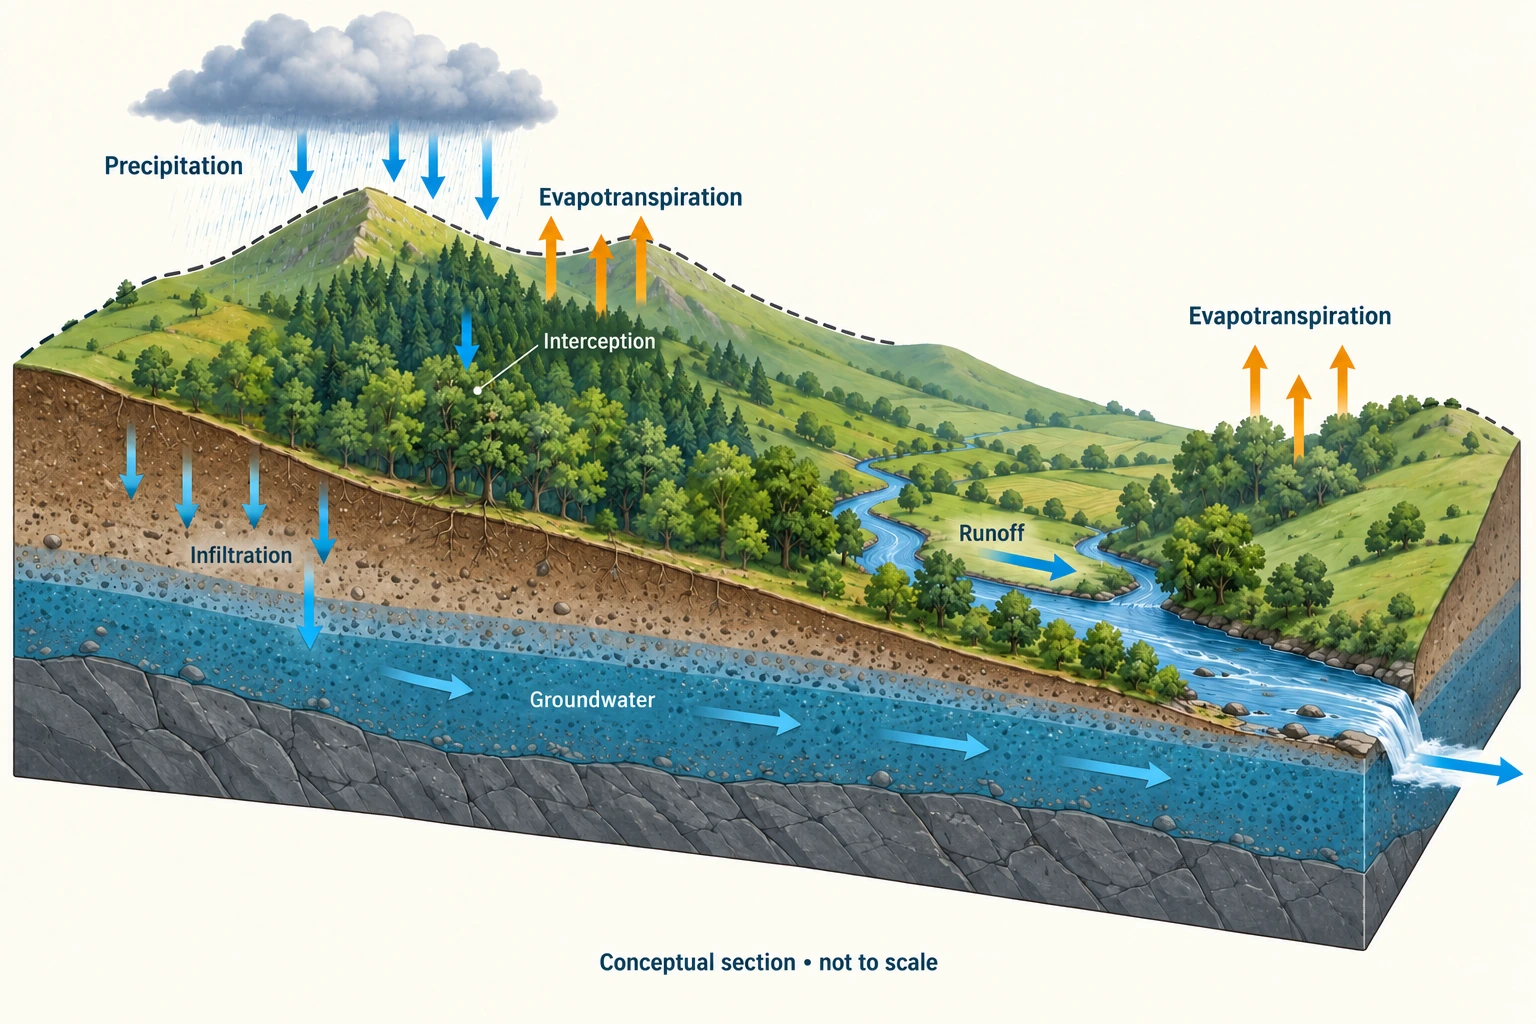
Image: illustration, not a documentary photograph. · Original generated teaching artwork; provenance retained. No, government or research-body endorsement.
3. Energy, precipitation and the meaning of a climate baseline
Evaporation requires energy to break liquid-water associations; solar heating and heat exchange support it. Transpiration transfers water through plants and depends on roots, stomata, available soil water and atmospheric demand. Evapotranspiration combines the two. Potential evapotranspiration describes demand under a specified assumption of adequate water; actual evapotranspiration can be much smaller in a dry soil. High temperature alone does not guarantee large actual losses. Wind, humidity, radiation, vegetation and available water all matter, so transferring a rate from a wet site to a dry one needs justification.
Air rising over relief, along a front or through convection expands and cools. Cooling toward saturation permits condensation where suitable nuclei are present; cloud formation alone does not guarantee surface rainfall. Droplets or ice particles must grow, fall and survive evaporation below the cloud. Orographic rainfall can produce a windward–leeward contrast, but a single wet hillside does not prove relief caused it: storm track and wind direction need checking. Condensation releases latent heat, linking phase change to atmospheric energy. Ice accumulation and ablation introduce seasonal and longer-term delays in water transfer.
Weather is the realised sequence over a short period; climate describes its statistical distribution over a defined reference interval. An anomaly is a departure from a baseline, not a direct measurement of a cause. A wet year can occur within a drying multi-decade trend. Monthly percent-of-average values need weighting by each month's reference amount to recover an annual percentage; simply averaging percentages gives each month equal influence even when baseline rainfall differs. State the reference period next to the comparison, not in a distant footnote.
The Met Office's 2 January 2025 provisional UK annual summary reports 1,242 mm for 2024, or 107% of the 1991–2020 average. This dated national aggregate was accessed on 4 October 2026; it is not a 2026 rainfall observation or a catchment rainfall input. Reverse calculation using rounded 107% gives an approximate baseline, not an independently measured exact one. It also hides regional and seasonal variation. A basin's water balance needs spatially representative precipitation over that basin and period, together with losses and storage information.
Warming can increase atmospheric moisture capacity and evaporative demand, yet circulation and moisture supply determine where rain falls. Avoid the universal claim 'warmer means wetter everywhere'. Changes in intense events, annual totals and dry-spell duration are distinct variables. More intense rainfall can increase fast runoff even when annual totals are unchanged. Land cover can alter roughness and moisture recycling, but attributing a rainfall shift to one local land change requires evidence that separates larger circulation changes. This causal caution will become central to the rainforest lesson.
Read the plate as a pathway diagram: upward arrows require energy, downward precipitation is an input, and cloud water is a temporary store. Its fixed cloud is not a weather map and its arrow widths cannot establish storm intensity. To make the model falsifiable, predict what should change if air rises more slowly or if soil water is exhausted; then identify observations that could distinguish the mechanisms. The original worked seasonal series below is intentionally different from the Met Office source so the calculation can test weighting without inventing real UK monthly data.
Worked example: Fictional two-season teaching data: reference rainfall is 200 mm in season A and 800 mm in season B. Sample-year rain is 300 and 720 mm respectively. Compare the unweighted mean percentage with the correct combined percentage. Separately estimate the Met Office 2024 annual baseline from the rounded figures 1,242 mm and 107%.
Evaluated extension (original task): Evaluate whether an annual rainfall anomaly supports a local flood-risk conclusion.
Season A = 150% of reference; B = 90%. Unweighted mean = 120%.
Combined actual = 1,020 mm; combined reference = 1,000 mm; correct combined percentage = 102%.
Rounded UK back-calculation: 1,242 / 1.07 ≈ 1,160.75 mm. Report about 1,161 mm, not an exact climatological observation.
The fictional weighting demonstration is not a reconstruction of the UK source series.
An annual rainfall anomaly is useful climatic context but does not, by itself, establish local flood risk. The exercise's two seasons have different reference totals:300 mm against 200 mm is 150%, while 720 mm against 800 mm is 90%. Averaging those percentages gives 120%, but the combined totals are 1,020 mm against 1,000 mm, giving 102% under the stated aggregation. The larger denominator receives greater weight. For these two seasons, the combined percentage weights each seasonal percentage by its reference rainfall total. An area-weighted spatial average would be a different problem requiring area weights. A headline percentage must therefore disclose its denominator and aggregation method before it supports an inference.
The dated Met Office account gives a separate real example: provisional UK rainfall for 2024 was 1,242 mm, 107% of average. Dividing the rounded numbers gives an approximate reference of 1,160.75 mm, not a newly recovered exact official baseline. The report was published on 2 January 2025, and provisional status and rounding limit precision. It neither reports a 2026 measurement nor states that every locality received 7% more rain. A national annual total can coexist with large regional contrasts. Treating it as a local storm observation would mix both scale and time interval before any flood mechanism was considered.
Flood response depends on how precipitation is delivered and how the catchment receives it. A concentrated storm can exceed infiltration or available storage even when annual rainfall is near average; a wet antecedent period can leave little storage capacity. Conversely, additional rain distributed across small events may partly be lost through evapotranspiration or stored without a large peak. Condensation and precipitation formation explain the arrival of water, but the energy needed for evaporation does not prescribe where or when that water falls. Changes in surfaces, drainage connectivity and abstraction introduce further differences between otherwise similar rainfall totals.
I would use the anomaly to motivate investigation, not to assign a flood probability. The stronger evidence would combine event rainfall intensity and duration, local antecedent moisture, measured discharge and catchment changes over comparable periods. Exposure and vulnerability must also be assessed: the same hydrograph can have different consequences where buildings or warning provision differ. A local risk conclusion becomes more persuasive if repeated observations and a tested mechanism connect changed rainfall to threshold exceedance, while alternative land-use explanations are examined. Without that evidence, the justified conclusion remains that rainfall differed from a stated reference, rather than that a specific place became predictably less safe.
Answer: The unweighted result exaggerates wetness by 18 percentage points. The correct fictional aggregate is 102%. The approximate UK reference inferred from rounded reporting is 1,161 mm.
Check your understanding: Transfer: why might two basins with equal annual rainfall have very different flood risks? Give a mechanism and a way to test an alternative explanation.
Answer: Rain concentrated in intense storms can exceed infiltration capacity, while evenly spread rain may replenish stores. Alternatively, geology or connected impermeable surfaces can route equal rainfall more rapidly. Compare sub-daily rain, antecedent moisture, permeability and discharge under similar storm conditions; annual totals alone cannot distinguish them.
Why: A causal answer separates input amount from timing and basin response. A reference climatology supplies a comparator, not a forecast or an attribution experiment.