8. Association is evidence: ranks, confounding and significance
By UK A Level Geography · independent study · myAudience
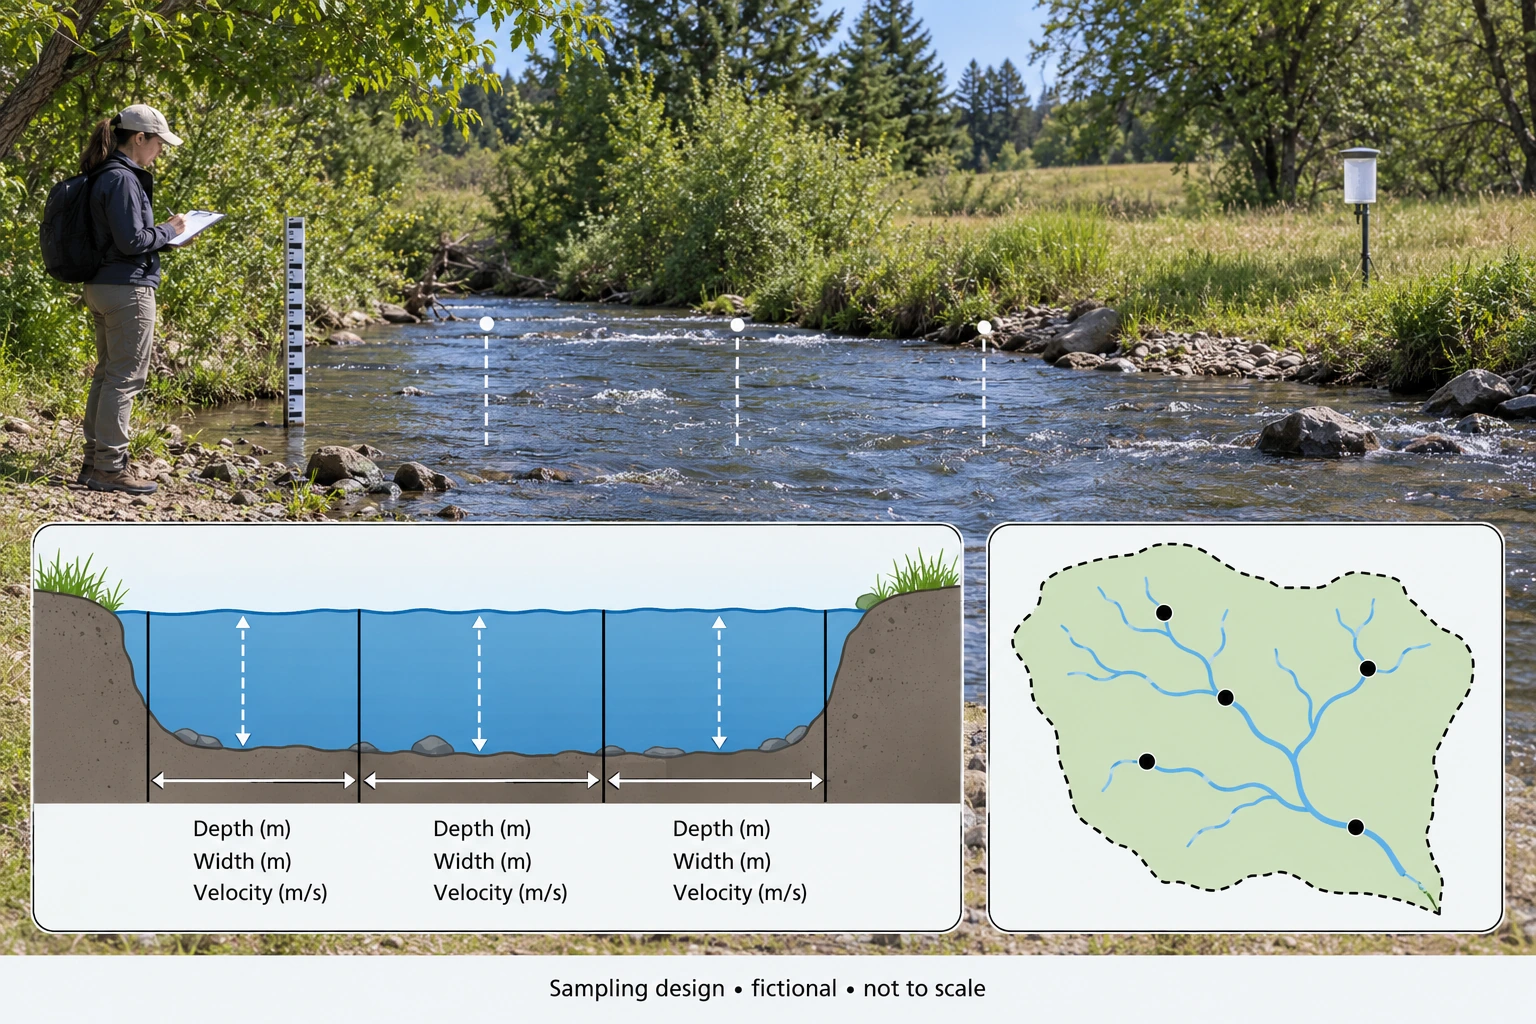
Image: illustration, not a documentary photograph. · Original generated teaching artwork; provenance retained. No, government or research-body endorsement.
8. Association is evidence: ranks, confounding and significance
Statistics compress patterns but do not supply causal mechanisms. The mean is sensitive to extreme values; the median describes a middle value; dispersion indicates how widely values differ. A scatter plot can reveal curvature, outliers and clusters that a single coefficient hides. Plot each observation with its units and spatial or temporal support before fitting a relationship. If nearby samples share soils or rainfall, treating them as independent replicates exaggerates the effective information. A large row count does not necessarily mean a large independent sample.
Spearman's rank correlation measures monotonic association. For n pairs without tied ranks, rₛ = 1 − 6Σd²/[n(n²−1)], where d is the difference between the two ranks. Rank both variables consistently; either ascending or descending can be used if the choice is coherent. Ties require average ranks and a method that handles them, rather than blindly applying the no-tie shortcut. A negative coefficient means high values of one tend to occur with low values of the other. It does not show the speed of change in physical units, because ranking discards distances between values.
Consider canopy cover and observed runoff in several small fictional plots. More cover may intercept water, improve soil structure and change transpiration, so an inverse relationship is plausible. But soil type, slope, compaction and initial moisture could jointly influence cover and runoff. Reverse selection is possible: trees may have survived where soils already infiltrate well. A graph supports a pattern; a mechanism explains why that pattern might arise; a controlled comparison or broader design tests rival causes. Treat those as separate stages of reasoning.
Significance concerns compatibility with a specified null model. It is not the probability that a causal explanation is true. Choose the test, tail, threshold and independence assumptions before interpreting the result. Small samples admit few rank permutations, while an asymptotic approximation can be poor. A non-significant result may reflect low power; a statistically detectable relationship may still be small or irrelevant to flood management. Report effect direction, uncertainty, sample design and practical magnitude alongside any test decision.
The worked data are original invented plot measurements for reasoning, not observations from a real forest. The sampling plate provides a prompt to ask whether points are distributed among relevant strata, not proof that this particular series was collected. An exact test considers all 120 permutations for five untied ranks and compares how often their absolute coefficients match or exceed the observed magnitude. This assesses the specified exchangeable-ranks null rather than making the coefficient itself a significance decision. No claim about real tree cover can be inferred from a probability calculated on teaching data.
A justified argument could favour a vegetation intervention as a hypothesis while withholding a causal claim. State that canopy–runoff association is consistent with interception and infiltration, then explain how common soil conditions could generate the same association. Propose matched plots across soils, repeated storms and antecedent moisture measurements. Predict how the relationship should change when canopy is removed or rainfall greatly exceeds interception capacity. This creates a transfer from description to a falsifiable mechanism without presenting a classroom test as evidence of real policy success.
Worked example: Original fictional paired plots A–E: canopy cover (%) = 10, 20, 30, 40, 50; runoff (mm) = 18, 12, 16, 8, 10. Compute ascending ranks and rₛ. Under independent exchangeable ranks use an exact two-sided permutation test for |rₛ| at least this large. Decide at 5%, without claiming causality.
Evaluated extension (original task): Evaluate the claim that the five-plot correlation establishes a land-cover effect.
Cover ranks = 1,2,3,4,5. Runoff ranks = 5,3,4,1,2.
Rank differences = −4,−1,−1,3,3; squares sum to 36.
rₛ = 1 − 6×36/[5×24] = −0.8. There are 120 possible rank permutations; 16 have |rₛ| ≥ 0.8, including equality.
Exact two-sided p = 16/120 = 0.1333. Do not reject this exchangeable-ranks null at 0.05.
The five-plot rank association does not establish a causal land-cover effect. The ordered ranks 1–5 paired with 5, 3, 4, 1, 2 give a coefficient of−0.8, indicating a strong negative ordering in this invented sample. Under the specified untied-rank permutation model, 16 of the 120 possible orderings have an absolute coefficient at least this large. The two-sided probability is therefore 16/120, approximately 0.133, exceeding a 5% significance level. This is an exact calculation for the declared random-order null, not the probability that the null is true or that a land-cover mechanism exists.
A non-significant result does not show that there is no association. With only five independent plots, the test has limited ability to distinguish an effect from variable ordering. It also requires an appropriate sampling and null model. Choosing a one-sided test after noticing the negative direction would change the question opportunistically; a directional alternative should be justified in advance. Equal or tied measurements need a suitable treatment of ranks rather than uncritically applying the untied shortcut. The precise coefficient is less important than understanding what data configuration, independence and comparison rule the calculation assumes.
Collecting 50 readings within the same five plots cannot automatically produce 50 independent units. Shared soil, topography or management can make readings within a plot dependent; repeated readings may improve that plot's estimate without adding independent plot-level evidence. Even a convincingly significant association could arise through a third variable, such as slope influencing both vegetation and infiltration. The invented sample is not field evidence from a named rainforest. The sampling plate can prompt design questions, but cannot supply missing observations or prove that plotted locations were selected randomly. Quantitative strength, sampling validity and causal attribution are distinct issues.
I would describe the negative sample ordering while rejecting the claim that these data establish a land-cover cause. The next study should obtain more suitably selected independent plots, record plausible confounders and specify the analysis before examining outcomes. Complementary process measurements and carefully justified comparisons may strengthen a causal account; qualitative evidence of management history can reveal omitted context. Where a cause cannot be isolated, a conditional association remains informative if reported honestly. A sustained conclusion should therefore combine the exact inferential limitation with the geographical mechanism and design evidence, rather than treating either a large coefficient or a 5% decision rule as a complete explanation.
Answer: The five fictional pairs show a strong inverse rank pattern (−0.8), but the exact two-sided test is not significant at 5%. A one-sided test would be a different pre-specified hypothesis; neither test establishes vegetation as the cause.
Check your understanding: Transfer: 50 readings are taken from the same five plots during ten consecutive minutes. Why is it unsafe to claim n = 50 independent plots? What would strengthen a causal argument?
Answer: Readings are nested within plots and close in time, so shared conditions produce dependence. Analyse the repeated structure or summarise by independent units. More separately located plots across matched soils, repeated independent storms and a defensible intervention comparison would better separate canopy effects from confounding.
Why: The pattern and the test decision can coexist. The exercise checks rank logic, exact probability, effect interpretation and sampling independence rather than turning a coefficient into a causal verdict.