12. Rainforest change: satellite area is not a carbon emission
By UK A Level Geography · independent study · myAudience
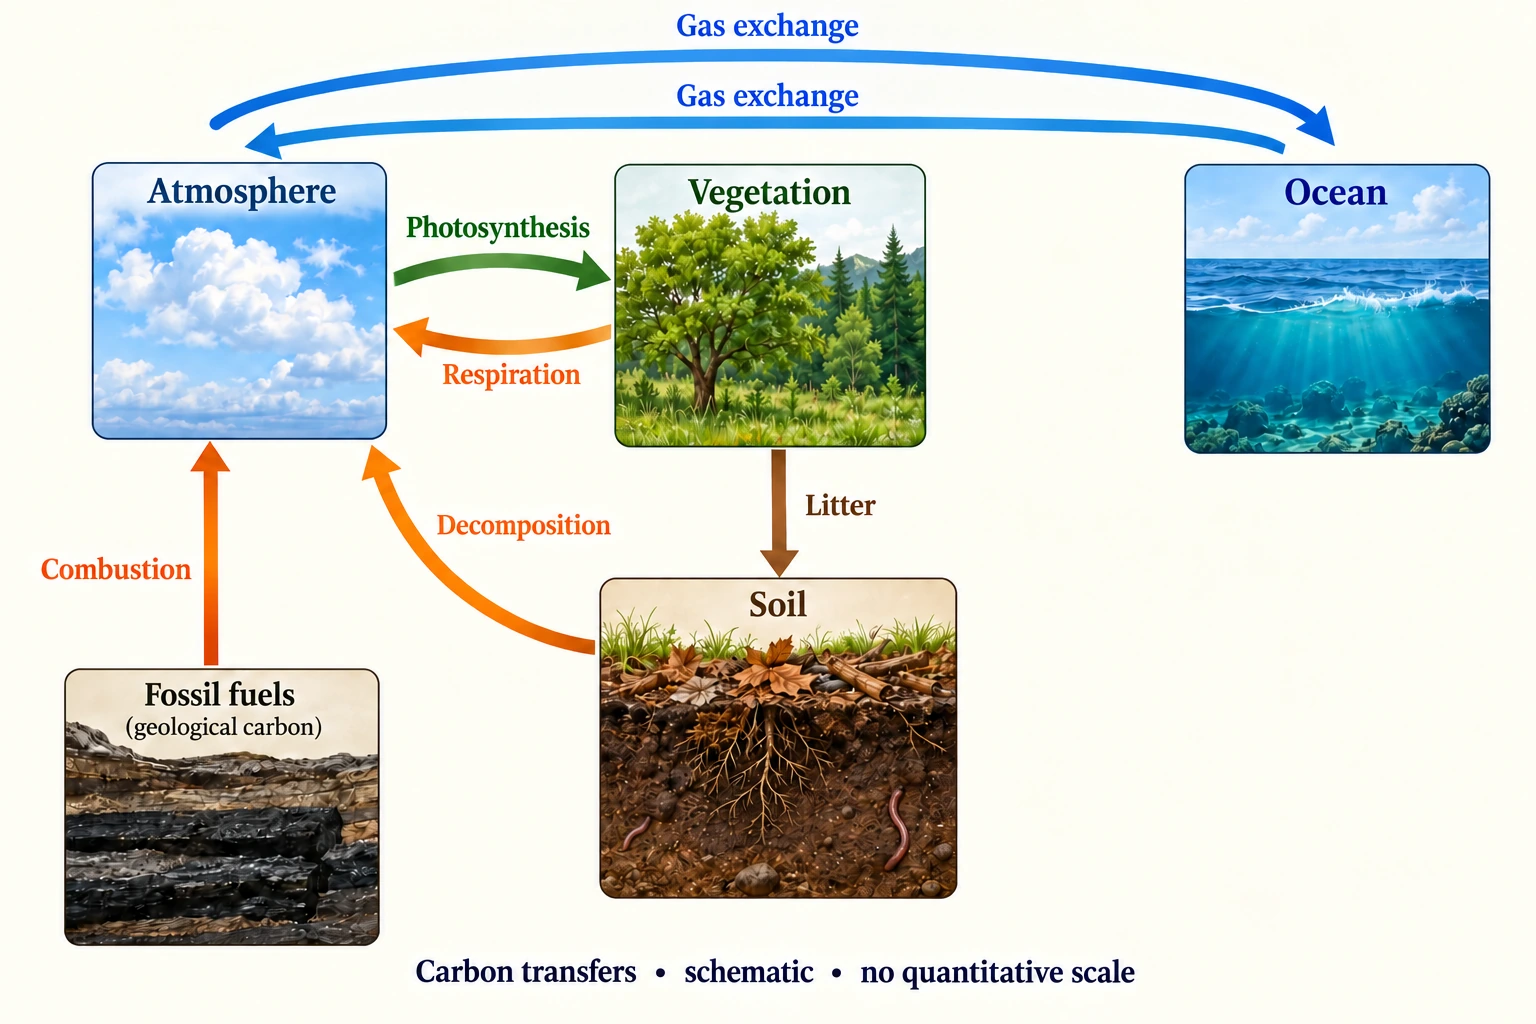
Image: illustration, not a documentary photograph. · Original generated teaching artwork; provenance retained. No, government or research-body endorsement.
12. Rainforest change: satellite area is not a carbon emission
A tropical rainforest links rapid biological transfers with water recycling and substantial carbon storage. Leaves intercept rainfall and transpire water; roots and soil structure influence infiltration; litter and decomposition transfer carbon through soils; photosynthesis and respiration oppose one another. These mechanisms do not imply identical conditions throughout the tropics. Soil, seasonality, forest age, drainage and human histories matter. To build a case study, locate the setting, distinguish intact and disturbed land, and evaluate evidence at scales from plots to a region rather than treating the word 'rainforest' as a uniform measurement.
The Brazilian Legal Amazon is an administrative monitoring region, not a synonym for the whole Amazon basin, the biome or Brazil. INPE's PRODES report published 18 August 2026, accessed 4 October 2026, gives a consolidated 2025 deforestation rate of 5,731 km² for 1 August 2024 to 31 July 2025, compared with 6,518 km² for the previous reporting year. It concerns mapped complete forest-cover removal under PRODES definitions. Partial degradation, regrowth and all carbon exchanges are different quantities. Older preliminary 2025 estimates must not be mixed with these consolidated values as if they were separate years.
The fall in annual cleared area is not an increase in forest area. Remaining clearing still removes forest; net regional area change also depends on the chosen forest definition and regrowth. An area rate is not a carbon-emission rate. To estimate carbon effects, you need initial stocks, the fate of biomass, combustion fraction, product storage, soil changes and regrowth through time. Satellite classification provides spatial evidence but can contain cloud, detection-threshold and classification uncertainties. A national or regional total can also conceal differing local trends and pressures.
Land-use change can weaken interception and evapotranspiration, alter surface roughness, disturb soils and release carbon. The net local water response may include reduced transpiration and greater runoff, but downstream rainfall depends on moisture transport and atmospheric circulation. Drought can reduce uptake and increase fire susceptibility without being caused solely by nearby clearing. Logging, agricultural expansion, enforcement, markets and livelihoods can interact. A responsible interpretation tests competing drivers rather than ascribing a measured change to one policy from two annual totals.
The conceptual carbon plate is reused for tracing pathways after clearing, not as a geographical map of the Legal Amazon or a representation of measured tropical stocks. No invented coordinates or pins identify an affected community. The fictional hectare calculation below is deliberately independent of PRODES. Multiplying it by the real regional area would create a spurious emissions estimate because no representative biomass or fate sample has been supplied. This lesson begins the required rainforest case study but leaves detailed located water/soil observations, human livelihoods and management comparisons outstanding.
A justified argument can favour reducing deforestation while acknowledging the evidence limit. The observed clearing-rate decline reduces new disturbance relative to the previous reporting year, under a consistent monitoring definition. It does not by itself prove a restored sink or reduced drought risk. Combine satellite series with field inventories, flux observations, weather records and transparent social/economic evidence before asserting those outcomes. Include whose interests a policy serves and whether pressure shifts elsewhere. The original explanatory prose is independent teaching, and INPE's observations remain attributed to their producer.
Worked example: First calculate the percentage change from the INPE consolidated 6,518 to 5,731 km². Separately model one fictional cleared hectare containing 120 tC: 40% immediately oxidises, 25% enters products, 35% remains as debris. In the next year debris emits 20% of its initial amount, products emit 10% of their initial amount, and regrowth takes up 4 tC. Find the immediate and following-year net atmospheric releases.
Evaluated extension (original task): Evaluate what the reported deforestation decrease establishes about water and carbon change.
Observed clearing-rate change = (5,731−6,518)/6,518 ×100 = −12.07% after rounding; reduction = 787 km².
Fictional immediate release = 48 tC; products = 30; debris = 42. Conservation: 48+30+42 =120.
Following-year release = 0.20×42 + 0.10×30 −4 = 7.4 tC. Remaining product 27, debris 33.6, regrowth 4; retained total 64.6.
Cumulative release = 55.4 tC and retained 64.6, summing to 120. Following-year net release expressed as CO2 = 7.4×44/12 ≈27.13 tCO2.
The reported decline in clearing is important evidence about a defined monitoring quantity, but it does not prove an increase in regional carbon stock. INPE's consolidated PRODES account, published 18 August 2026, reports 5,731 km² for the Legal Amazon during 1 August 2024–31 July 2025, compared with 6,518 km² in the previous reporting year. The reduction is 787 km², or 12.07%. This is lower annual clearing, not negative clearing or a 12% increase in standing forest. The monitoring region and definition matter: complete primary-forest canopy removal, including the final stage of progressive degradation, is not a direct inventory of every carbon store or all ecosystem disturbance.
The fictional hectare model demonstrates why area and emissions should remain separate. Of 120 tC, 40% or 48 is immediately oxidized, 25% or 30 enters products and 35% or 42 remains as debris. The following year's prescribed debris loss 8.4 and product loss 3 are partly offset by 4 uptake from regrowth, giving 7.4 tC net atmospheric release. Products 27, debris 33.6 and regrowth 4 retain 64.6; cumulative net release 55.4 plus retained 64.6 still equals 120. These destinations and delays prevent all initial stock from being counted as instantaneous emission. Their fractions are chosen teaching assumptions, not measured Legal Amazon emissions factors.
Water-cycle change also needs process and observational evidence. Removing canopy can reduce interception and alter evapotranspiration, infiltration, soil condition and runoff, but the direction and magnitude of measured response depend on subsequent land use, soil and rainfall. A lower regional clearing rate does not establish that previously cleared catchments have recovered their storage or rainfall recycling. Nor does it distinguish all effects of fire, degradation and climatic stress. The carbon plate explains possible transfer routes without representing a real clearing site, while the basin plate cannot turn a national monitoring statistic into measured local hydrological change.
I would state that the consolidated annual clearing rate decreased while substantial new clearing continued. To assess regional stock change, representative biomass and soil inventories, product/debris fate and regrowth measurements are needed, with atmospheric exchanges and disturbance considered. To assess water effects, located catchment observations should connect land-cover changes to rainfall, evapotranspiration, storage and runoff over comparable intervals. Combining those sources can support a stronger water–carbon explanation, but the fictional hectare factors should never be multiplied into the real reported area as though they were verified emissions data. The decline is encouraging for the monitored outcome; wider ecosystem recovery remains an evidence question.
Answer: The INPE observed annual clearing-rate decline is 12.07%. The separate fictional hectare releases 48 tC immediately and 7.4 net in the following year. These are model fate assumptions, not Amazon emissions factors.
Check your understanding: Transfer: a newspaper says 'deforestation fell 12%, therefore the Amazon's carbon stock rose 12%'. Rewrite the claim and identify two missing observations needed to assess regional stock change.
Answer: The consolidated PRODES clearing rate for the Legal Amazon fell about 12.07% between the two reporting years, while 5,731 km² was still cleared. Stock change requires representative pre/post biomass and soil inventories plus carbon fate and regrowth information; atmospheric and climatic conditions also matter for net exchange.
Why: The model differentiates area, stock and flux and preserves delays in carbon release. Attribution needs more than an annual correlation, and the monitoring region must remain correctly named.