13. Pickering: evaluating a flood intervention counterfactual
By UK A Level Geography · independent study · myAudience
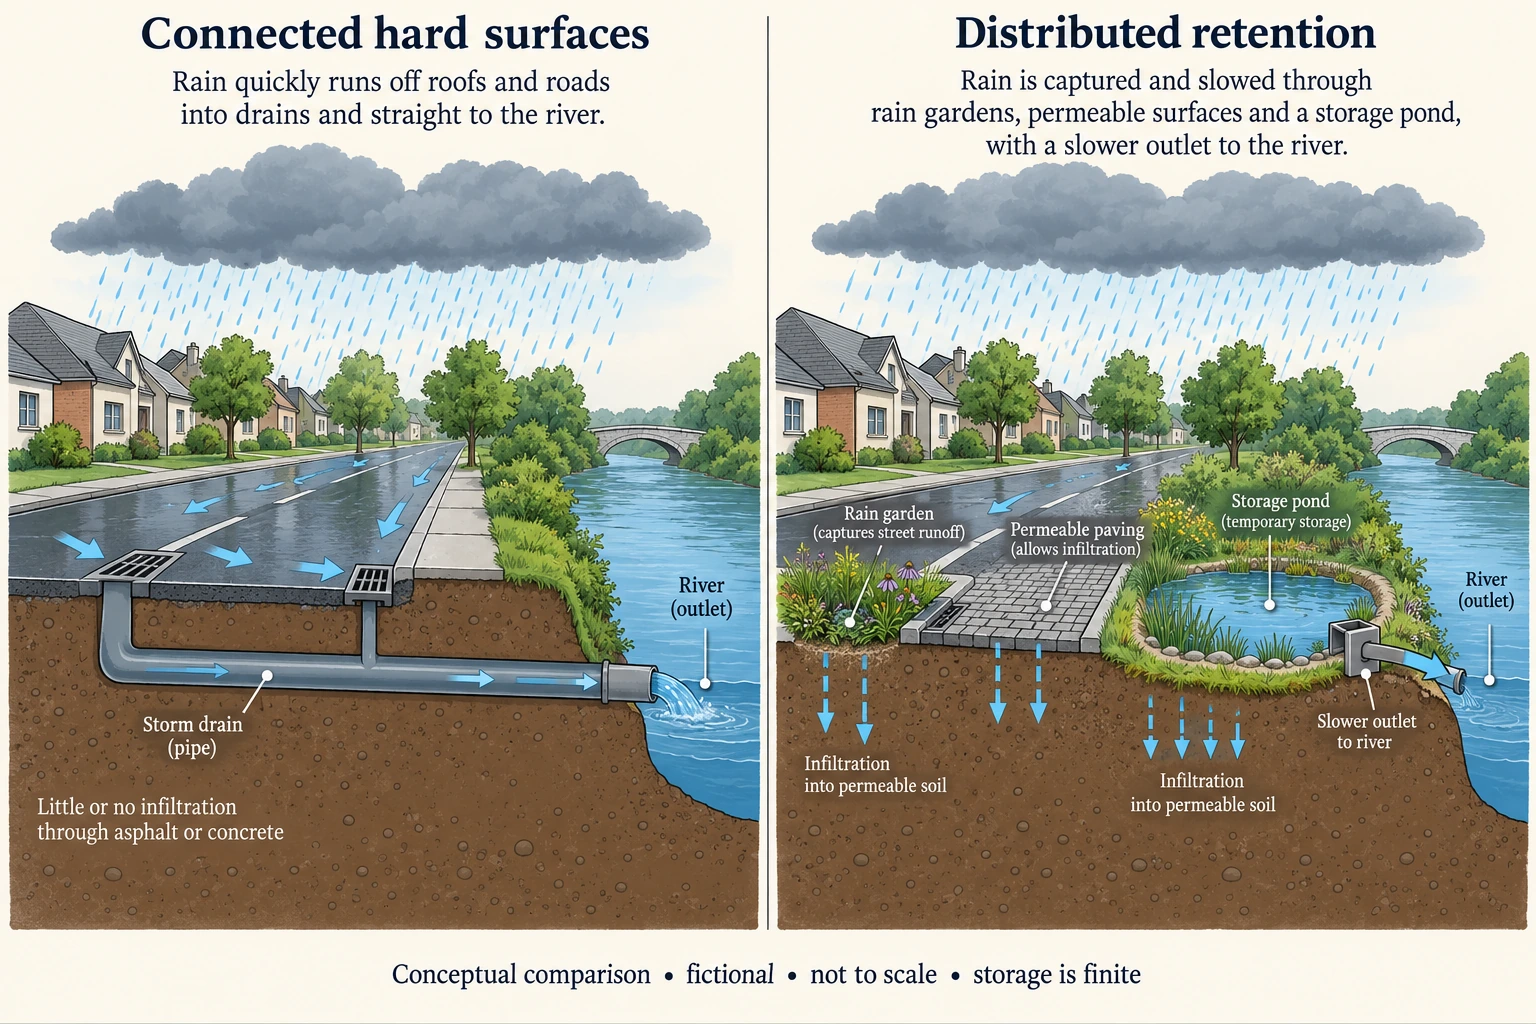
Image: illustration, not a documentary photograph. · Original generated teaching artwork; provenance retained. No, government or research-body endorsement.
13. Pickering: evaluating a flood intervention counterfactual
Evaluating a flood intervention asks what would have happened under the same event without it. We cannot simultaneously observe a treated and untreated version of the same catchment. The counterfactual must be estimated with a model, comparison catchment, earlier events or other evidence. Each approach has assumptions. A town that avoids flooding after new measures may have benefited from them, but it may also have received less rain or had drier soils. A credible evaluation examines those possibilities and states the difference between observed outcome and estimated avoided damage.
Forest Research's account of the Slowing the Flow project at Pickering, North Yorkshire, describes assessment of the Christmas Day and Boxing Day 2015 event. Its estimate is around a 15–20% reduction in the flood peak, with roughly half attributed to upstream land-management measures and half to the main flood-storage area. This is a dated event-specific research estimate, accessed 4 October 2026, not a direct paired measurement of two simultaneous rivers or a universal reduction for every storm. The source itself describes debate over rainfall severity and what the event tested.
Upstream roughness, restored vegetation and leaky structures can delay transfers, while a storage area retains water temporarily and releases it later. Mechanisms operate at different points in the basin and depend on antecedent conditions and available capacity. Once storage fills, additional rain can spill through. A lower peak can coexist with unchanged event volume, as lesson 6 demonstrated. Attribute success to the combination actually assessed rather than assigning the whole percentage to tree planting. Read the urban plate as a general storage-and-routing analogy; it is not an image of Pickering or of its exact structures.
The spatial scale of benefit matters. Measures that slow a tributary can reduce downstream coincidence or increase it depending on timing. Costs include land use, maintenance and who receives protection; benefits include reduced damage and possibly ecological improvements. Maintenance failure or debris can change performance. A comparison should track downstream flow, capacity use and real impacts across multiple events, including events that exceed design expectations. One successful counterfactual estimate should strengthen a conditional claim rather than close all questions of long-term effectiveness.
Uncertainty can arise in observed discharge, rainfall spatial sampling, rating curves and the untreated simulation. Distinguish an estimated treatment effect from a percentage computed on measured discharge alone. If observed peak is Q and reduction relative to the untreated peak is r, untreated peak is Q/(1−r), not Q×(1+r). The denominator is the baseline without intervention. Reversing it incorrectly underestimates the avoided peak, particularly for large effects. A threshold comparison can nevertheless be inconclusive if its uncertainty ranges overlap the estimated untreated peak.
An extended answer should judge effectiveness against an explicit outcome and interval. For this event, evidence supports a contribution from combined storage and land management to lower peak flow. Transfer to a wetter or larger storm remains uncertain without capacity and routing evidence. The example below applies the published percentage range to a wholly fictional discharge; it does not reconstruct an actual Pickering flow record. That separation allows algebra practice while avoiding fabricated real catchment data. Completing the local-catchment study still needs checked field datasets and a fuller water-supply/flooding evaluation.
Worked example: Fictional basin observed peak with measures = 17 m³/s. Apply an illustrative 15–20% reduction relative to the untreated peak, using the range reported for the separate 2015 Pickering assessment. Estimate untreated peaks. A fictional channel threshold is 20 m³/s, but observed treated peak uncertainty is ±1 m³/s. Can every combination establish avoided threshold exceedance?
Evaluated extension (original task): Evaluate the strength and transferability of the catchment-management conclusion.
At 15%, untreated = 17/0.85 =20 m³/s. At 20%, untreated =17/0.80 =21.25 m³/s.
The nominal range is 20–21.25, not 19.55–20.4 obtained by multiplying by 1.15–1.20.
Combining supplied hard bounds: minimum =16/0.85 ≈18.82; maximum =18/0.80 =22.5 m³/s.
The treated upper bound 18 remains below 20, but the counterfactual range overlaps the threshold. A universal avoided-exceedance claim is unsupported.
The catchment-management claim is strongest when it specifies both the intervention package and the event to which its evidence applies. Forest Research estimates that the combination of measures at Pickering reduced the Christmas 2015 flood peak by around 15–20%, with roughly half the reduction attributed to upstream land management and half to the main storage area. This supports a bounded account of benefit from a package. It is not a measurement of trees alone or a universal efficiency for every urban catchment. Different rainfall, antecedent moisture, soils and available storage can change the response substantially.
The fictional calculation also depends on the correct comparison denominator. A treated peak of 17 m³/s after a 15% reduction implies an untreated peak of 17/0.85=20 m³/s; after a 20% reduction it implies 21.25. Multiplying 17 by 1.15 or 1.20 would not reverse the original percentage relationship. With the treated peak's chosen±1 m³/s hard bounds, the untreated range expands to 16/0.85≈18.82 through 18/0.80=22.5. The treated upper bound 18 is below the illustrative 20 threshold, but some untreated combinations are also below it. The model therefore cannot establish avoided threshold exceedance in every permitted case.
Observing no flooding is consistent with intervention benefit, yet a causal evaluation asks what would have happened without the measures. That counterfactual is not observed directly, so its rainfall inputs, representation of prior conditions and model uncertainty need examination. A storage feature can fill during a larger storm, and delayed releases may interact with tributaries downstream. The conceptual retention plate shows finite storage and an outlet; it provides no measured 15–20% response. Monitoring repeated events, rainfall across the basin, discharge, storage use and downstream consequences would improve the match between the claimed mechanism and the observed outcomes.
I would conclude that the dated Pickering evidence supports benefits from the assessed package, while the separate numerical scenario demonstrates a conditional counterfactual rather than a guaranteed avoided flood. A stronger local decision would compare suitably tested untreated simulations or defensible controls, record maintenance and assess who benefits or bears displaced risk. If comparable evidence consistently shows safer levels without harmful downstream timing, investment is better supported. If capacity is exhausted or uncertainty leaves threshold crossing unresolved, a combination of measures and overflow planning is needed. The qualified conclusion remains useful precisely because it identifies conditions under which the benefit may strengthen, weaken or fail.
Answer: Nominal untreated peaks are 20–21.25 m³/s; the enlarged illustrative envelope is 18.82–22.5. The observed treated model value stays below the threshold, but not every plausible untreated combination exceeds it.
Check your understanding: Transfer: assess this statement: "The town did not flood, so the new trees prevented all flood damage and will do so in larger storms." Give a bounded replacement and a monitoring plan.
Answer: Avoided flooding is consistent with benefit from the assessed combination of measures, but rainfall, prior moisture and untreated-model uncertainty also matter. Monitor rainfall across the basin, discharge and storage use before/during/after repeated storms, compare untreated simulations or suitable controls, and record downstream damage and maintenance. Larger storms may exhaust storage.
Why: A causal counterfactual can support a qualified judgment without becoming a universal claim. The inverse percentage and overlapping bounds prevent a visually attractive success story from outrunning the supplied evidence.