Educational differences: explaining a pattern without blaming a group
By UK A Level Sociology · independent study · myAudience
Original myAudience educational illustration. Image: illustration, not a documentary photograph. · myAudience educational illustration; no affiliation with any awarding body.
Educational differences: explaining a pattern without blaming a group
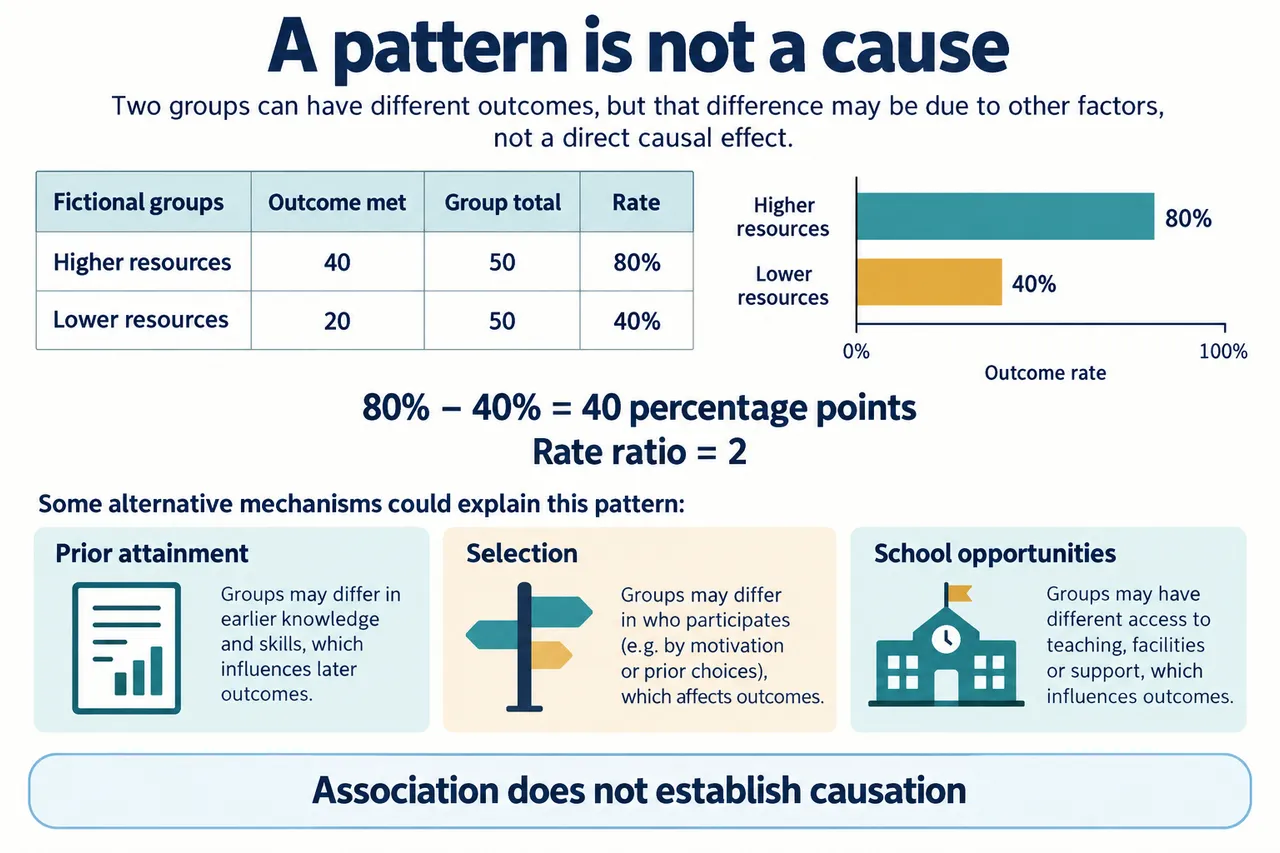
An outcome difference is a starting point for explanation, not an explanation in itself. In the entirely fictional records, 40 of 50 higher-resource students and 20 of 50 lower-resource students meet a specified outcome. The rates are 80% and 40%. The difference is 40 percentage points; the rate ratio is two. These are descriptions of these records. They do not show individual ability, explain the pathway producing the difference or represent a population beyond the stipulated school.
Define resources before arguing about their effects. Money, quiet study space, available time, equipment and support are related possibilities, but not interchangeable measures. A broad household category may conceal different combinations. One possible mechanism is that study space makes sustained practice easier; another is that caring or paid-work commitments reduce available time. Neither follows automatically from membership of a category. The same resource can also be used differently, so variation within groups matters to an explanation.
Institutional arrangements can mediate circumstances outside school. Equipment provision may reduce one access difference, while allocation to particular teaching groups may magnify another. Mediation means that a process helps transmit an effect; it differs from a competing cause that produces both the resource classification and the outcome. Treating every variable as something to control can remove a pathway one is trying to understand. A causal account therefore needs a reasoned sequence, not merely a list of correlated characteristics.
Prior attainment offers a plausible alternative or interacting explanation. Students may enter the measured period with different educational histories, and admissions or subject choices may select who appears in each group. Missing records could also alter the proportions. These possibilities do not establish that resources are irrelevant. They establish that the observed association cannot isolate their contribution. An explanation is stronger when it makes those rival processes explicit and asks what observations would distinguish them.
This study topic includes educational differences involving class, gender and ethnicity, but this introductory mechanism example does not substitute for the full evidence across those dimensions. Resource groups must not be silently converted into ethnic or gender categories. Describe how a classification was made and avoid assigning motivation or ability to everyone within it. Internal diversity and agency are compatible with patterned disadvantage. A systematic association can be socially important without determining the future of any particular person.
A useful design would combine consistent measures with an account of selection and timing. Records could trace educational trajectories; interviews could investigate how support was obtained and used. Neither source supplies all the answers. A later improvement after new support may be suggestive, but changing cohorts and other reforms remain alternatives. A methodological judgement should explain why a particular source answers a particular question and what it cannot establish, rather than rank numbers above accounts or accounts above numbers.
The model evaluates a deliberately excessive causal claim. Its arithmetic is correct, but the claim goes beyond the records. Follow the distinction between a defensible resource hypothesis and proof of that hypothesis. The unfamiliar transfer changes the group sizes: 20 of 25 and 40 of 100 still give 80% and 40%. Raw totals can reverse their apparent comparison while the rates remain the same. Explain each denominator before comparing a count, a percentage or a ratio.
The table and bars use a common 0–100% scale, with explicit totals of 50 in each group. The alternative-mechanism cards are hypotheses, not findings about a real school. The diagram supports the descriptive calculation; it cannot supply the missing causal evidence. In a written conclusion, retain both parts: unequal resources offer plausible mechanisms worth examining, while these fictional numbers do not prove that those mechanisms caused the observed difference.
Worked example: Entirely fictional records show a specified outcome for 40 of 50 higher-resource students and 20 of 50 lower-resource students in one school. Evaluate the claim that this proves the difference is caused by unequal resources.
The records establish an association within the stated fictional school, not a causal explanation. The outcome rates are 80% and 40%, a difference of 40 percentage points and a rate ratio of two. These calculations use each group's own denominator. They do not describe all schools, measure individual potential or show that resources caused the observed difference.
A resource explanation is plausible because access to study space, time, equipment or additional support may influence opportunities to learn. The causal chain must nevertheless be specified. A broad label such as higher resources could combine household income, housing and support arrangements whose effects differ. Some lower-resource students succeed and some higher-resource students do not; variation within groups is compatible with a probabilistic mechanism and rejects a deterministic judgement about individuals.
Other explanations remain possible. Prior attainment might be related both to the resource classification and to the outcome. Admissions or subject selection could produce groups with different educational histories. School processes might also mediate the association: access to advanced teaching could depend partly on prior performance, making it difficult to isolate household resources from institutional responses. Controlling a variable without considering its place in the causal sequence can remove part of the mechanism one wants to understand.
A stronger investigation would define resource indicators and the outcome consistently, examine selection and missing records, and compare educational trajectories rather than a single endpoint. Interviews could investigate how students use available support, while records establish patterns that individual accounts cannot represent alone. Changes in support provision could be studied cautiously with an appropriate comparison, but a later improvement would still require consideration of changing cohorts and other reforms. No method should be presented as automatically delivering causality.
The claim is therefore too strong. Unequal resources offer a defensible hypothesis with identifiable mechanisms, and the association makes it relevant to investigate. Yet these numbers cannot distinguish resource effects from alternative or interacting processes. Nor should categories of class, ethnicity or gender be turned into descriptions of everyone's motivation. A good explanation connects circumstances and institutional arrangements to evidence while retaining individual agency, uncertainty and internal diversity. The conclusion is an evidential limit, not a denial that resource inequality can matter.
Answer: The fictional outcome rates are 80% and 40%, a 40 percentage-point gap and a ratio of two. Unequal resources are a plausible mechanism, but these records alone cannot separate their effect from prior attainment, selection or differences in school opportunities.
Check your understanding: A second fictional school records 20 successes among 25 students in group A and 40 among 100 in group B. It says B performs better because 40 is larger than 20. Correct the comparison and state one remaining inference limit.
Answer: A has 20/25=80%; B has 40/100=40%. The larger count in B reflects its larger denominator and does not imply a higher rate. The rate difference is 40 percentage points and ratio 2. Neither comparison identifies a cause, and the group labels alone supply no explanation. Define the outcome/populations and investigate selection, measurement and educational circumstances before generalising.
Why: Keep the concept and denominator precise, show the inference, and distinguish supported descriptive results from unestablished causes or generalisations.