Numbers and meanings answer different questions
By UK A Level Sociology · independent study · myAudience
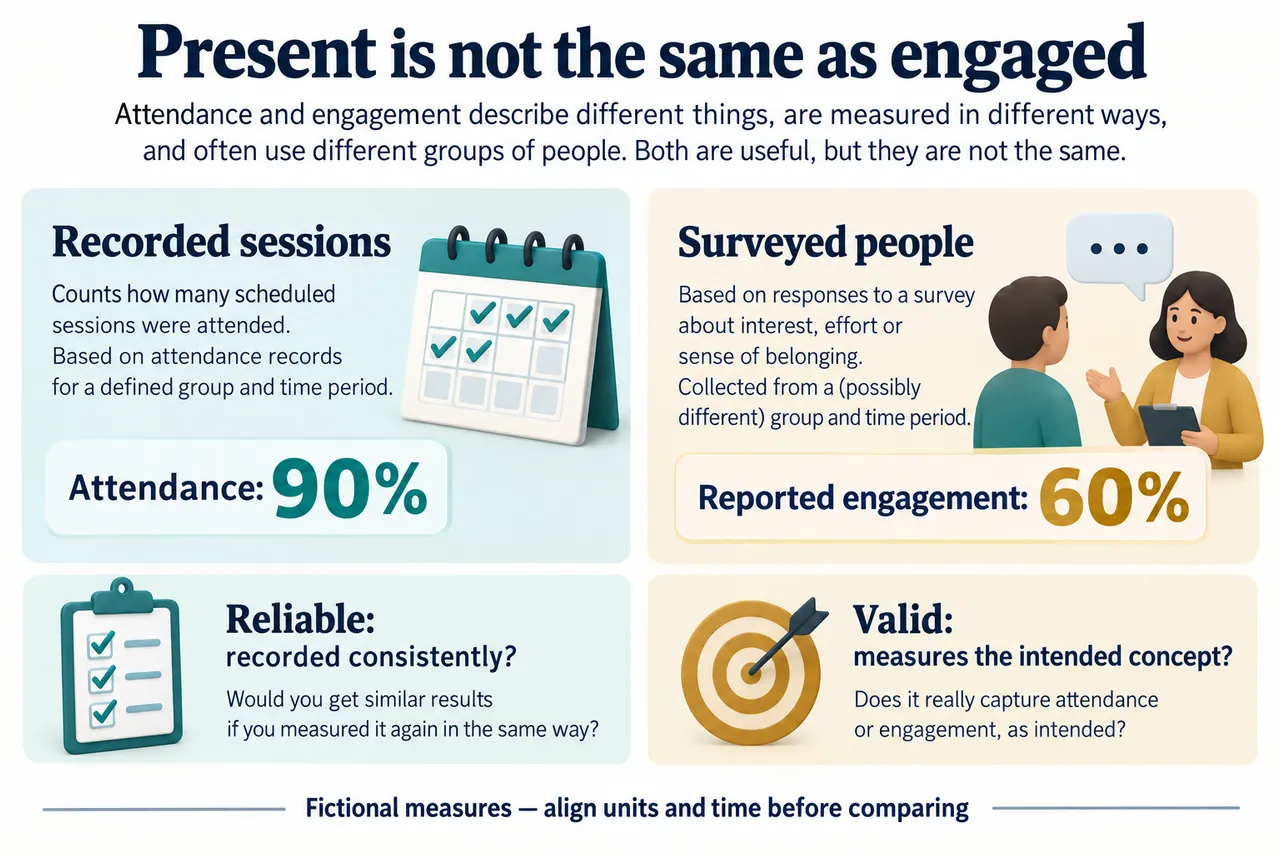
Original myAudience educational illustration. Image: illustration, not a documentary photograph. · myAudience educational illustration; no affiliation with any awarding body.
Numbers and meanings answer different questions
Attendance and engagement are different concepts. A register can record presence at scheduled sessions, while a survey asks people about interest, effort or belonging. In the fictional example, attendance is 90% and reported engagement is 60%. They need not contradict each other because they may count different units, use different time periods and refer to different experiences. Before comparing the values, state what each numerator and denominator means and who is absent from each source.
Operationalisation turns an abstract concept into something observable. Recording presence is one possible indicator for attendance, but a definition still has to settle lateness, partial sessions and authorised absence. Engagement is broader: visible participation, concentration and a reported sense of involvement are related but distinct indicators. An indicator can be useful without exhausting the concept. A transparent study explains the choice and its limits instead of treating an easily recorded measure as the whole social phenomenon.
Reliability concerns consistency of measurement. Two administrators applying the same attendance rule should reach similar classifications, and repeating a procedure under comparable conditions should not introduce arbitrary changes. Validity concerns whether the procedure measures the intended concept. A perfectly consistent presence rule does not establish how involved a student felt. Distinguish these questions: improving the consistency of a measure may be worthwhile even when its fit to a broader construct still requires investigation.
Quantitative data can summarise distributions and comparisons, while qualitative material can reveal meanings and unexpected processes. These are distinctions in the form and use of evidence, not automatic rankings of truth. An interview may be recorded with consistent categories, and a numerical dataset may depend on interpretive judgements made while coding. Primary evidence is collected for the present investigation; secondary evidence already exists. That distinction is separate from whether the material is numerical or textual.
Positivist approaches tend to seek systematic patterns and explanations that can be scrutinised through observable evidence; interpretivist approaches emphasise how participants understand their social world. Do not turn those tendencies into bans on particular methods. Researchers can choose a source because it addresses a question while remaining explicit about its assumptions. Asking what a reported experience means is different from estimating its prevalence, and a defensible design may need both without pretending that they are interchangeable.
An apparent discrepancy can improve a study. Students may attend regularly yet describe exclusion or boredom. Those accounts would suggest questions about relationships and opportunities, but not prove a population-wide cause. Align units and periods before examining the connection. Linking identifiable records to personal accounts would involve ethical and privacy decisions not authorised by this exercise. Analysing source differences is useful; gathering classmates' sensitive information without appropriate review is not a necessary learning activity.
The model explains why 90% and 60% alone do not describe the quality or cause of education. The transfer asks about coders agreeing on 38 of 40 classifications. That is 95% agreement, not proof that the classifications capture students' understanding. They might share the same inadequate definition. Explain what the agreement calculation establishes, then identify evidence needed for construct validity. Avoid treating a precise percentage as a substitute for a reasoned account of the measurement.
The image places recorded sessions and surveyed people in separate cards rather than portions of one total. The calendar checkmarks are symbolic and must not be counted to derive the 90% value. The reliability and validity cards pose different questions. Reading the picture critically means noticing which units are supplied and which details remain unstated; an attractive diagram cannot repair a mismatched denominator or guarantee that an indicator measures what a study intends.
Worked example: A fictional register reports 90% attendance, while 60% of surveyed students say they felt engaged last week. Evaluate whether these measures contradict each other and whether numbers are more objective than accounts.
The measures need not contradict one another because attendance and experienced engagement are different concepts. A student can be physically present without feeling involved, or miss a session while remaining interested in the subject. The percentages also refer to potentially different units: recorded sessions and surveyed people. Before comparing them, establish exactly who and what was counted, the time period, missing records and the survey's wording.
A quantitative register offers a standardised indicator that can be compared across classes or weeks. Consistent recording could make it reliable, meaning repeated measurement follows the same rule. Yet reliability does not guarantee validity for engagement. A definition based on presence omits attention, participation and students' sense of belonging. Administrative categories can also reflect decisions about lateness or authorised absence. The numerical form does not remove judgement from how a measure is produced.
Students' accounts can investigate meanings that a register cannot supply. An interpretive approach might ask how they understood engagement and how classroom relationships affected it. An open interview can identify an unexpected explanation, such as feeling excluded despite regular attendance. It may also be influenced by interviewer relationships, recall and willingness to criticise teaching. Qualitative detail is not automatically a more accurate population estimate, just as a percentage is not automatically an objective explanation.
The strongest design starts from the research question. If the question concerns presence, inspect recording procedures and use the register with appropriate limits. If it concerns lived engagement, obtain accounts and explain how participants were recruited and interpretations developed. If it concerns the relationship between the two, align time periods and units, then analyse both convergence and discrepancy. Linking identifiable records would require justified permissions and safeguards; the fictional example does not authorise gathering classmates' personal information.
The appropriate judgement is therefore that the apparent conflict exposes a measurement problem rather than proving one source false. Different methods can make different aspects of schooling visible. Objectivity should involve transparent concepts, procedures and scrutiny of alternative interpretations, not the assumption that numbers are free from values. A defensible study would state what each source can establish, document uncertainty and preserve disagreements that might improve the explanation. Neither 90% nor 60% alone demonstrates the quality of education or its cause.
Answer: The 90% attendance and 60% reported engagement figures need not contradict one another: they concern different concepts, units and possibly groups or periods. Neither numerical records nor personal accounts are automatically more objective; their definitions, consistency, validity and missing information must be evaluated.
Check your understanding: A coding rule counts every spoken contribution as understanding. Two coders agree on 38 of 40 intervals. Does their agreement validate understanding?
Answer: Agreement is 38/40=95%, an indication of consistency for that coding rule. It does not establish that speaking measures understanding; repetition, confusion and unequal opportunity to speak are alternative interpretations. Examine the construct with additional evidence and analyse disagreements. The 95% is not a chance-corrected reliability coefficient or a causal result.
Why: Keep the concept and denominator precise, show the inference, and distinguish supported descriptive results from unestablished causes or generalisations.