Sampling and the people a survey misses
By UK A Level Sociology · independent study · myAudience
Original myAudience educational illustration. Image: illustration, not a documentary photograph. · myAudience educational illustration; no affiliation with any awarding body.
Sampling and the people a survey misses
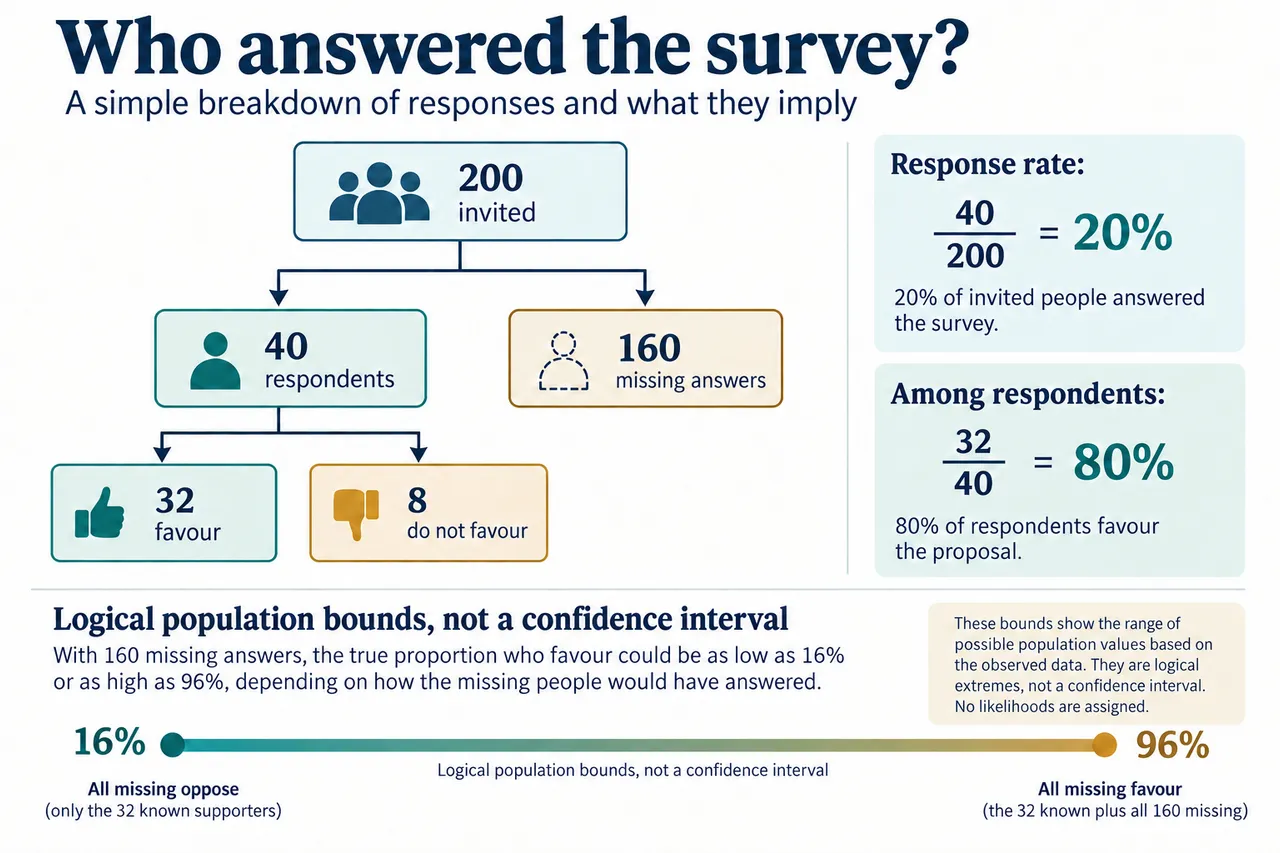
A survey result depends on who was eligible, who was invited and who replied. The fictional school invites 200 eligible students; 40 respond, and 32 of those favour a timetable change. Response is 40/200 = 20%, while support among respondents is 32/40 = 80%. Neither denominator can be silently substituted for the other. A precise summary of the observed replies is not automatically a precise description of the eligible population.
A sampling frame lists the people or units from which a sample is selected. Incomplete coverage can exclude some eligible people before any response decision occurs. A probability sampling design assigns known selection probabilities, allowing a particular inferential framework under its assumptions. That does not ensure participation. Nonresponse occurs after selection or invitation, and it can matter when the reasons for replying are related to the answers a study seeks. Separate coverage, selection and response rather than treating all missing people as the same problem.
Nonresponse bias is not measured solely by the response percentage. If strongly affected students are especially motivated to reply, the observed support may differ from the population's support. If those students have less time or access, the direction could be different. These are hypothetical mechanisms, not findings supplied by the fictional case. Bias depends on how respondents differ from nonrespondents in relation to the question. A higher response rate can be helpful without guaranteeing representative answers.
The missing answers permit logical bounds without assumptions about their distribution. At minimum only the 32 observed supporters favour the change, giving 32/200 = 16%. At maximum all 160 nonrespondents also favour it, giving 192/200 = 96%. This interval describes possible population values consistent with the records. It is not a confidence interval, an equally likely set of forecasts or evidence that a central value is more plausible. Its width exposes the information that the observed replies do not supply.
Improving a design requires explaining the mechanism one hopes to address. Accessible invitations could improve coverage; reminders might increase response; a clearly worded question could improve interpretation. Each still needs voluntary participation. Weighting by known characteristics can alter the calculation under assumptions about how those characteristics relate to response and answers. It cannot recover every missing view merely by making an analysis more elaborate. A responsible report describes the actual procedure and what remains unknown.
Policy decisions also involve whose needs are heard. A timetable may affect travel, caring arrangements and other commitments differently. Consultation can investigate those experiences without pretending that a response percentage is a complete mandate. Keep prevalence questions separate from questions about mechanisms or practical consequences. A few carefully analysed accounts may identify a problem worth addressing, but they do not establish how common it is. Ethical participation and methodological transparency support one another without being identical standards.
The evaluated model rejects the statement that 80% of all students favour the change while retaining the correct respondent calculation. In the transfer, 60 of 100 invited people reply and 45 favour a proposal. Response is 60%, support among respondents is 75%, and the logical population bounds are 45% to 85%. The denominators and missing count change together. Show the lower and upper constructions so that the reader can follow why the bounds differ from the respondent percentage.
The branching diagram divides 200 invitations into 40 responses and 160 missing answers, then divides only the responses into 32 favourable and eight unfavourable replies. The icon figures are symbols, not individual records. The end labels describe extreme possibilities, not prediction or probability. All values are fictional teaching data. Read the arrows as membership of categories and the fractions as separate questions; no branch justifies assigning unobserved answers to the missing group.
Worked example: An entirely fictional school invites 200 eligible students to a survey. 40 respond; 32 favour a timetable change. Evaluate the claim that 80% of students favour it.
The 80% result describes respondents because 32 of 40 favoured the change. It does not describe all 200 eligible students unless an additional and justified inference is made. The response rate is 40/200, or 20%. Keeping these denominators separate prevents a precise calculation from acquiring a population meaning it has not earned.
The main concern is whether responding is associated with views about the timetable. Students strongly affected by travel or caring arrangements might be especially motivated to reply, while others might have less access to the invitation. Equally, satisfied students could be more willing to support the school. These are competing hypothetical processes; the scenario does not show which occurred. A small response rate increases concern about missing information, but bias depends on differences between respondents and nonrespondents, not on the percentage alone.
Without assumptions about the 160 missing students, population support could range from 32/200=16% to 192/200=96%. The lower bound treats every nonrespondent as not favouring the change; the upper treats every nonrespondent as favouring it. These bounds are logical possibilities, not a 95% confidence interval and not equally likely forecasts. They show how little the observed records alone determine the population proportion. Claiming 80% for the whole school hides the unobserved answers.
A better investigation would describe the invitation and response process, check coverage of the eligibility list and examine whether responses vary across relevant circumstances. Accessible reminders might improve participation, provided refusal remains genuinely voluntary. Probability sampling could support a different inferential framework, but cannot guarantee that selected people respond or that the questionnaire measures their views accurately. Weighting by known characteristics may help under assumptions; it cannot correct differences that have not been measured simply by increasing the calculation's complexity.
The defensible report is that 32 of 40 respondents favoured the proposal, with 40 responses from 200 invitations. The school should avoid presenting this as a mandate from 80% of its students. It could combine cautious reporting with further consultation about different needs and the practical consequences of the timetable. The case illustrates why methodological transparency matters to policy: whose views are absent can affect decisions, even when the arithmetic among the people heard is completely correct.
Answer: Only 20% of the invited students responded, and 80% of those respondents favoured the change. Population support could logically range from 16% to 96%, so the incomplete responses do not establish that 80% of all students favour it; these extreme bounds are not a confidence interval.
Check your understanding: A fictional census invites all 100 staff and gets 60 responses, 45 supporting a change. Give response/support rates and population bounds; explain why this is not a completed census.
Answer: Response 60%; support among respondents 45/60=75%. Without assumptions, full-population support lies between 45/100=45% and 85/100=85%. All were invited, but 40 outcomes remain unobserved, so it is not a complete enumeration of opinions. These are logical bounds, not confidence limits. Investigate nonresponse and report denominators explicitly.
Why: Keep the concept and denominator precise, show the inference, and distinguish supported descriptive results from unestablished causes or generalisations.