From evidence to policy: a claim needs a comparison
By UK A Level Sociology · independent study · myAudience
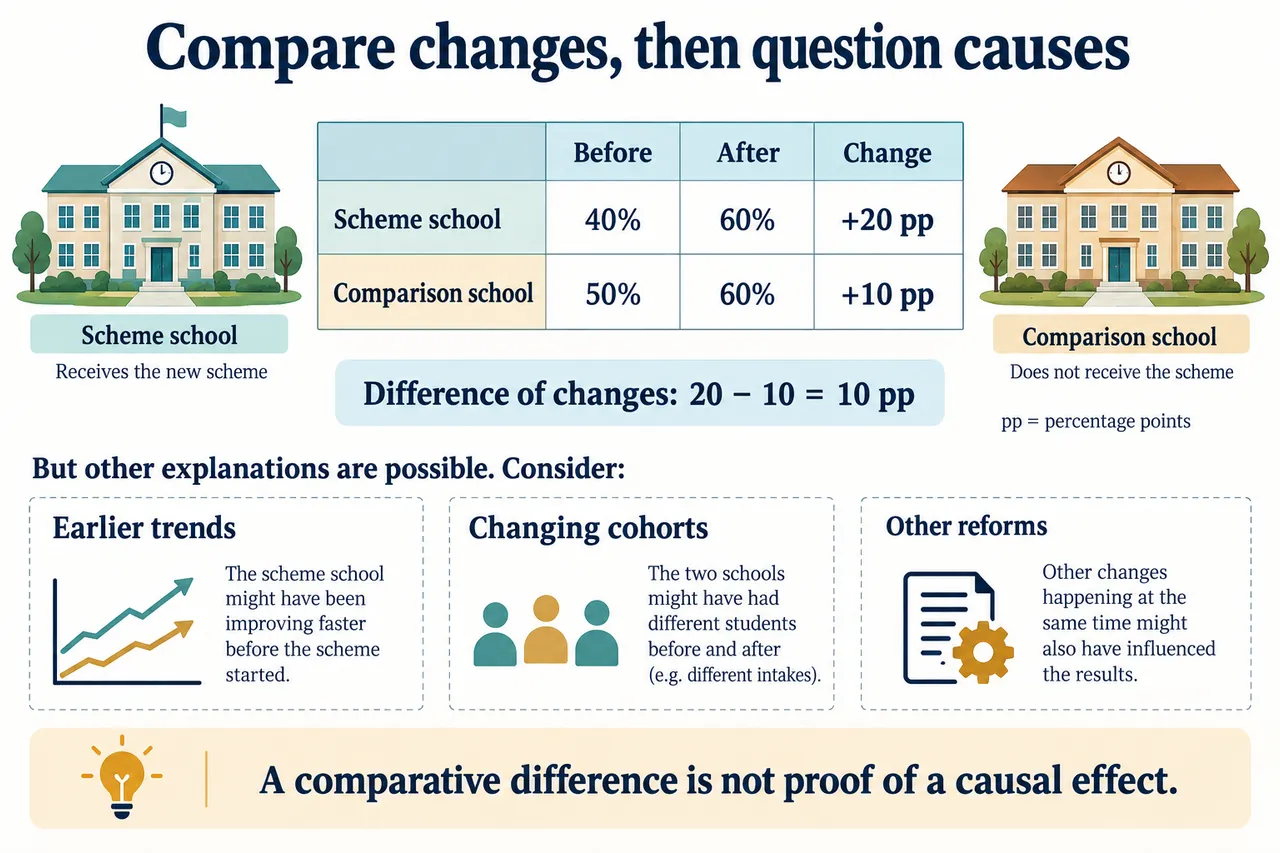
Original myAudience educational illustration. Image: illustration, not a documentary photograph. · myAudience educational illustration; no affiliation with any awarding body.
From evidence to policy: a claim needs a comparison
An intervention followed by improvement does not establish that the intervention caused all of the improvement. In the fictional case, a scheme school moves from 40% to 60% on a stipulated outcome. A comparison school moves from 50% to 60% over the same period. The changes are 20 and ten percentage points; their difference is ten percentage points. This descriptive comparison challenges attribution of the whole 20-point increase but does not independently prove a ten-point causal effect.
The missing question is counterfactual: what would have happened to the scheme school without the scheme? The comparison school may help address it only under assumptions about comparability. Earlier trends, intake and other support could differ. The starting percentages alone neither establish nor destroy a useful comparison. Describe the relevant process and justify why another setting might approximate the unobserved alternative. A comparison is a design choice to defend, not a mechanical device that removes every rival explanation.
Selection can complicate the example. A scheme might be introduced because a school had an unusually poor result, after which some return toward a typical value could occur. Changing admissions, exclusions or missing records might alter the measured percentage without equivalent changes for the same individuals. Other reforms could happen at the same time. These are possible explanations to investigate, not claims about a real school. Causal reasoning is improved by identifying their timing and predicted observations.
Measures must also be comparable. Define the outcome, eligible group and missing-data rule consistently before subtracting rates. A percentage-point change differs from a percentage change relative to the baseline: moving from 40% to 60% is 20 percentage points and a 50% relative increase. The model uses the former. Mixing those units would produce an incorrect contrast. No sample sizes or uncertainty model are supplied here, so the exercise cannot provide a statistical significance claim.
Implementation accounts can help explain how a policy operates. An attendance record for a support session does not reveal whether its content met learners' needs. Interviews might expose a timetable barrier or identify a change in ordinary teaching alongside the scheme. Such accounts develop mechanisms and alternatives but do not replace a sound outcome comparison. Combining methods means analysing how sources address different questions and where they disagree, not declaring a causal conclusion because several forms of evidence exist.
Policy evaluation involves values as well as evidence. A reform may improve an average outcome while distributing gains unevenly or imposing different burdens. Decisions also concern cost, access and which educational goals are prioritised. State those criteria rather than present the statistical comparison as a complete decision. A sociological judgement connects power, institutional purpose and participants' experiences to the evidence, while distinguishing a measurable consequence from the normative question of whether it is desirable.
The evaluated model gives a conditional conclusion about additional benefit and specifies the assumptions behind it. The unfamiliar transfer changes the comparison school's movement to 30%–50%. Both schools now improve by 20 percentage points, so the difference of changes is zero. That zero does not prove no effect: comparability and simultaneous changes still matter. Explain what the descriptive result does establish and what additional evidence would be needed before supporting a causal verdict.
The illustration's table gives the exact fictional before/after values and labels pp as percentage points. The small earlier-trends lines are schematic possible alternatives, not measured histories or numerical data. School icons and cohort figures are symbols. Keep the diagram's headline warning in the conclusion: the comparative difference is a useful descriptive result that requires an argument about causes. None of these invented values represents current UK policy outcomes or a guaranteed reform effect.
Worked example: A fictional support scheme school rises from 40% to 60% on a stipulated outcome; a comparison school rises from 50% to 60% over the same period. Evaluate whether the scheme caused a 20 percentage-point improvement.
The scheme school improved by 20 percentage points, from 40% to 60%. The comparison school improved by 10 percentage points, from 50% to 60%. The difference between changes is therefore 10 percentage points. This calculation challenges the assertion that the entire 20-point rise should be attributed to the scheme, but it does not by itself establish that the scheme caused the remaining 10 points.
A comparison matters because outcomes can change without a particular intervention. Examination difficulty, other support, cohort composition or wider conditions might affect both schools. If the schools would otherwise have followed comparable trends, the difference of changes could be informative about the scheme's additional contribution. That is an assumption about an unobserved alternative, not a fact proved by having a comparison group. Their different starting rates neither automatically refute nor confirm it.
Investigate earlier trends and why the comparison was selected. A school chosen because its outcome was unusually low might improve partly through regression towards a more typical value. Changes in admissions, exclusions or which students have complete records could also alter percentages without the same individuals experiencing equivalent improvement. Other reforms might occur alongside the scheme. Measures need consistent definitions, denominators and time periods before even the descriptive comparison can be trusted.
Accounts of implementation could explain what support actually involved and who accessed it. Interviews might reveal that timetables prevented some students from attending, or that teachers changed ordinary practice as well. These are hypothetical possibilities, not results of a real study. Such accounts can develop mechanisms and identify alternative explanations, but do not replace a sound outcome comparison. Combining methods should expose limitations rather than declare a causal conclusion through the number of sources used.
The final judgement separates evidence and policy values. The school has a recorded 20-point improvement, while the comparison suggests that attributing all of it to the scheme is unjustified. A 10-point comparative difference is consistent with an additional benefit under important assumptions; causality remains uncertain. Deciding whether to retain the scheme also involves costs, distribution of benefits and what educational goals are valued. A sociological evaluation should state those criteria explicitly, report whose experiences are missing and consider plausible alternatives. The fictional figures are a reasoning exercise, not contemporary UK policy evidence or a guaranteed reform effect.
Answer: The scheme school’s rise is 20 percentage points, but the comparison rises by ten, leaving a ten-point difference of changes. Neither the whole 20-point rise nor the remaining comparative difference is proven causal without justified counterfactual assumptions and evidence about earlier trends, changing cohorts and other reforms.
Check your understanding: The fictional scheme school rises 40%→60%, but its new comparison rises 30%→50%. Is the scheme proven ineffective?
Answer: Both changes are 20 percentage points, so the difference of changes is 0. Under an appropriate comparison design this provides no evidence of an additional improvement on that particular measure. It does not prove there was no effect: comparison trends, spillovers, selection and measurement may be unsuitable, and other outcomes/distributions could change. State the limited result rather than turn 0 into a universal policy judgement.
Why: Keep the concept and denominator precise, show the inference, and distinguish supported descriptive results from unestablished causes or generalisations.