Research evidence is not a promise of customers
By UK A Level Business · independent study · myAudience
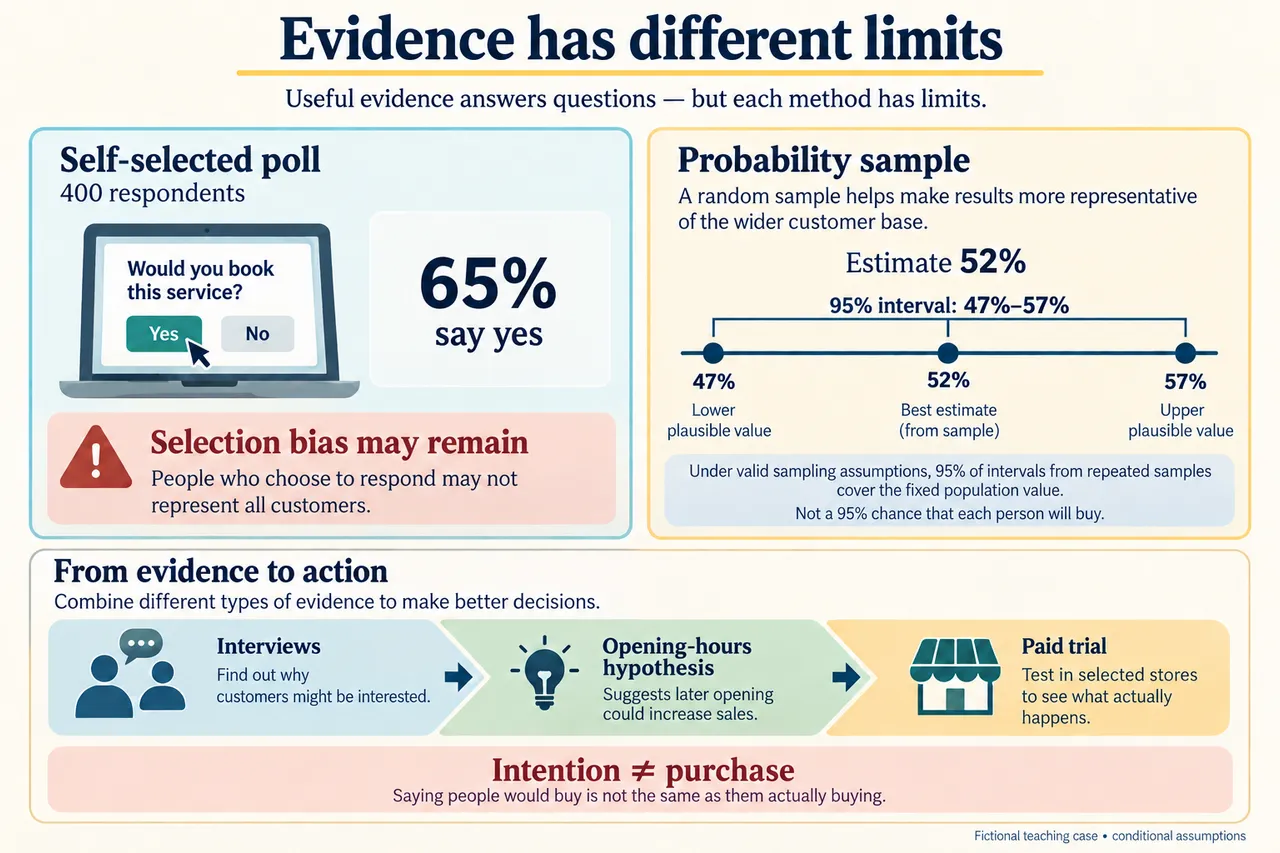
Original myAudience educational illustration. Image: illustration, not a documentary photograph. · myAudience educational illustration; no affiliation with any awarding body.
Research evidence is not a promise of customers
Research begins with a decision and a population, not with a questionnaire. The fictional venture wants to estimate willingness to book among a specified target population, then decide whether and how to launch. A survey of people already following its online account may answer a different question: what interested followers say. Define the population, time period and meaning of willingness before comparing percentages. The more expensive or irreversible the planned investment, the more important it becomes to examine whether the evidence actually addresses the decision.
Primary research collects information for the investigator’s purpose; secondary research uses information already collected. Neither label establishes quality by itself. A carefully designed new sample can match the venture’s question, but costs time and money. Existing evidence may cover a larger population, yet use an unsuitable definition, geography or date. Quantitative evidence measures quantities or patterns, while qualitative evidence can explore interpretations and mechanisms. A decision may need both: an estimate of how common interest is and an explanation of why interest does not become a booking.
The self-selected online poll has four hundred respondents and sixty-five per cent say yes. People who notice the poll and choose to respond may differ from people who do neither. Increasing the number of such responses can give a more stable description of the responding group without making it representative of the target population. Nonresponse, inaccessible groups and inaccurate answers can cause additional problems. Sample size therefore matters, but does not replace a valid selection process or a well-defined question.
The separate probability-sample estimate is fifty-two per cent, with a reported ninety-five per cent interval from forty-seven to fifty-seven. The case stipulates a valid design and interval method; it does not derive those limits from raw survey records. A frequentist interpretation concerns the procedure: if sampling and interval construction were repeated under its assumptions, about ninety-five per cent of the resulting intervals would contain the fixed population value. It is not a statement that each respondent has a ninety-five per cent chance of purchasing, nor a guarantee about this one realised interval.
Precision describes how tightly an estimate is bounded under the procedure. At the same confidence level and otherwise suitable method, a narrower interval indicates less sampling uncertainty; raising the confidence level generally widens the interval when other conditions stay fixed. Sampling intervals do not automatically include nonresponse, inaccurate answers or a question that nudges respondents towards yes. These errors need their own investigation. Do not use the apparent precision of a numerical output to conceal an unsuitable population or a flawed measurement.
Interviews suggesting that opening hours conflict with work schedules provide a possible mechanism. Interest may be genuine, but customers cannot attend when the service operates. Changing the hours could address that obstacle. Detailed accounts can help develop the explanation and identify wording for later research; a few interviews cannot establish the proportion of the population with that difficulty. Similarly, mapping competitors on price and opening-time accessibility might reveal an opportunity, but axis choice and missing alternatives can change the apparent gap. A map is an analytical choice, not an objective proof of empty demand.
Combining evidence means understanding what each source contributes, rather than taking an unweighted average of every available percentage. The online sixty-five and probability-sample fifty-two estimates have different selection processes; fifty-eight point five is an arithmetic average without an established population-estimation justification. A paid trial can investigate behaviour more directly than stated willingness. It still needs scrutiny because novelty, promotional discounts or seasonal timing may alter the result. Record actual paid bookings and costs, and compare what can be learned with the trial’s price and reversibility.
The plate separates self-selection, the stipulated interval and the pathway from interviews to a hypothesis and trial. Its interval is a range on a number line, not a distribution of individual buying probabilities or a sales forecast. The model recommends using suitable sample evidence for prevalence, interviews for explanation and behaviour evidence for conversion. The transfer narrows the interval while retaining the need to investigate other errors. A stronger evidence-based decision recognises several distinct uncertainties instead of allowing a precise-looking number to answer every question.
Worked example: Fictional venture wants to know the proportion of a specified target population willing to book. One self-selected online poll has 400 respondents and 65% say yes. A separate stipulated probability-sample estimate is 52% with a reported 95% confidence interval 47%–57%, assuming the design and interval method are valid. Interviews identify inconvenient opening hours but do not estimate their population prevalence. No model converts stated intention directly into paid sales.
The venture should rely more heavily on the defined probability-sample estimate for a population claim, while using the interviews to improve the offer and a small paid trial to test behaviour. The online poll reports sixty-five per cent willingness to book, but its four hundred respondents selected themselves. People already interested in the service may have been more likely to notice or complete the poll. A large number of responses does not repair that selection mechanism. Treating sixty-five per cent as a reliable proportion of the whole target population would therefore be unjustified.
The separate sample estimates willingness at fifty-two per cent, with a reported ninety-five per cent interval from forty-seven to fifty-seven per cent. Under the stipulated valid design and interval method, that interval describes sampling uncertainty. Across repeated samples, the procedure would produce intervals containing the fixed population value about ninety-five per cent of the time. It does not mean that each customer has a ninety-five per cent chance of booking or that this particular interval is guaranteed to contain the value.
Even a defensible sampling interval does not capture every source of error. Unreachable respondents, inaccurate answers and a question that prompts favourable responses can change the estimate. The two results also need the same definition of willingness, target population and time period before they can be compared. The interval does not itself prove that the online figure is wrong; it gives stronger grounds for caution about the online poll’s population interpretation.
Interviews supply a different kind of evidence. Explaining that opening hours conflict with working schedules suggests a mechanism through which interest may fail to become a booking. Changing hours could therefore improve access. Yet a few detailed accounts cannot establish how many people share that difficulty. Combining qualitative explanation with a suitable quantitative design is more informative than declaring one method universally better.
I would not use either percentage as a sales forecast without an additional assumption about conversion to paid bookings. A time-limited trial at alternative opening hours could reveal willingness to pay and operational costs. Its results would still need checking for novelty and seasonal effects. Where the investment is costly or difficult to reverse, the value of this extra information is greater. The justified decision is therefore to improve and test the offer before a large commitment, not to average the two percentages and pretend that the resulting number is a reliable market estimate.
Answer: A sustained original evaluated response: apply the stated case, verify the appropriate numerical endpoint, challenge assumptions, compare consequences and justify a conditional decision. No guaranteed business success or official mark/grade is asserted.
Check your understanding: A manager wants to average 65% and 52% to 58.5%. Explain why this need not be a valid estimate; if a valid design reports 52%±3 percentage points instead, what does the narrower interval establish and what does it leave unresolved?
Answer: The 58.5 percent arithmetic is correct but the combination has no justified weighting or common sampling design. Under a valid stipulated design the new interval is 49–55 percent and is narrower, indicating greater sampling precision at the stated confidence level. It does not by itself eliminate selection/nonresponse/measurement errors, prove a causal opening-hour effect or convert intentions into purchases.
Why: Use the exact stipulated inputs, period, units and denominator; recalculate before judging. Distinguish supported conditional arithmetic from demand, causation, ethics or legal arrangements that the case does not establish.