When a growing business loses market share
By UK A Level Business · independent study · myAudience
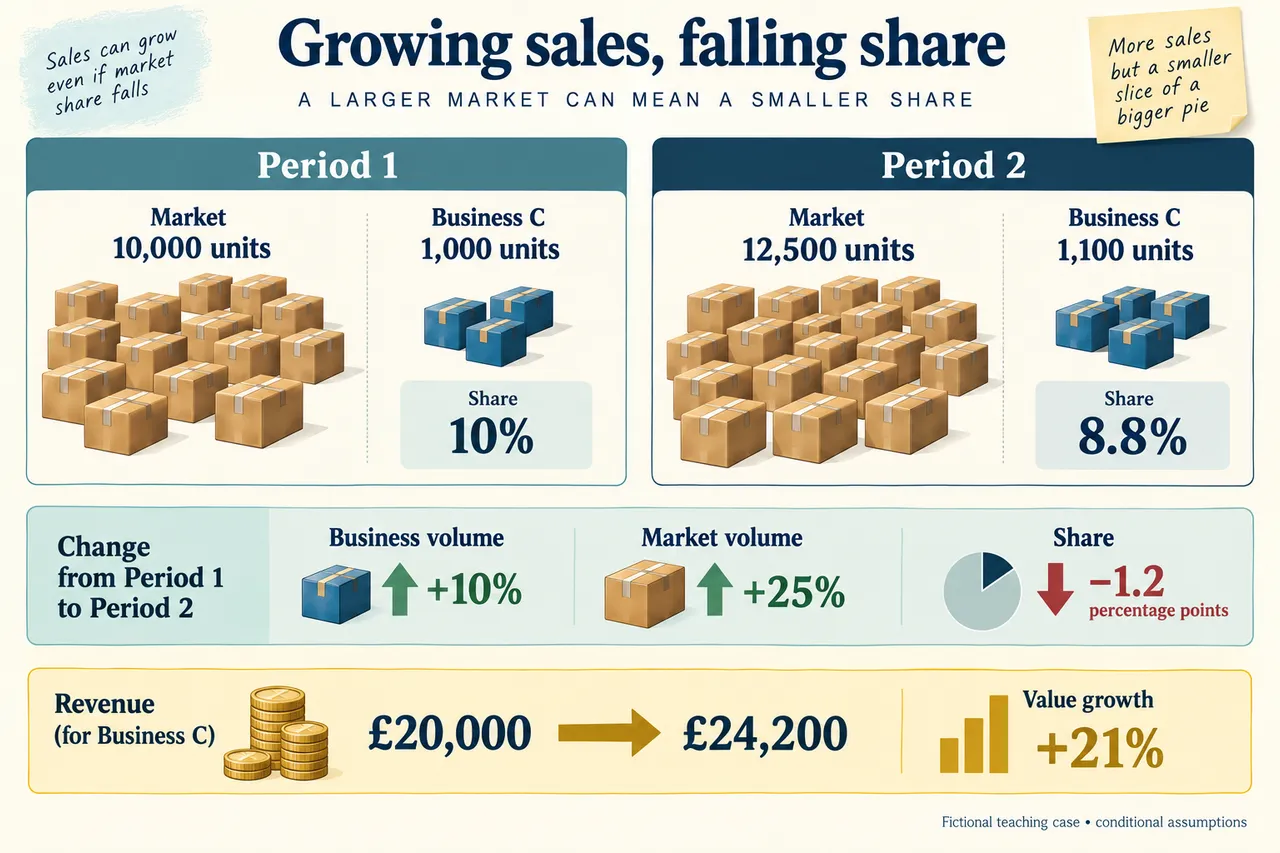
Original myAudience educational illustration. Image: illustration, not a documentary photograph. · myAudience educational illustration; no affiliation with any awarding body.
When a growing business loses market share
A market is a defined set of exchanges or potential customers for a particular offer, period and area. Its size can be measured in units or money, and a segment is a deliberately specified part of that market. The fictional example uses the same unit-based definition in both periods. Real comparisons can fail when product boundaries, geography or time change. Specify those choices before calculating growth or share. Even a correct division cannot repair a denominator that refers to a different population from the numerator.
Businesses may sell to other businesses, to consumers or facilitate exchanges between consumers. Goods and services can also have different purchasing patterns and operational requirements. A company selling technical equipment to a few organisational buyers may need account relationships and specification discussions, while a consumer offer may reach many individual purchasers. These are contextual possibilities, not universal rules. Competition, customer behaviour and market expansion should be examined in the specific setting before deciding which marketing response is useful.
In the case, the market grows from 10,000 to 12,500 units. The increase of 2,500 divided by the original 10,000 gives twenty-five per cent. C grows from 1,000 to 1,100 units, an increase of one hundred or ten per cent. Both quantities increase, but at different rates. Using the later value as the growth denominator would answer a different question. Growth describes a relative change from a base; it should not be confused with the absolute size of either organisation or market.
C’s share is its units divided by the same-period market units. That gives ten per cent initially and eight point eight per cent later. The difference is minus one point two percentage points. Relative to the original ten-per-cent share, the decline is twelve per cent. Percentage points describe the subtraction of percentages; a percentage change describes a difference relative to its original base. Keeping both interpretations explicit avoids making a small-looking point change seem identical to the corresponding relative change.
Revenue can change for price as well as quantity reasons. C’s first-period price of £20 yields £20,000 revenue; £22 with 1,100 units yields £24,200. The twenty-one-per-cent increase in value is not a twenty-one-per-cent increase in items sold. Indices can help compare relative movements: setting each volume series to one hundred initially produces one hundred and ten for C and one hundred and twenty-five for the market later. Equal index bases do not imply equal original quantities. Changes in product mix or inflation can complicate money comparisons further.
Marketing-return measures need a defined profit numerator and credible attribution. The case stipulates £750 additional profit attributable to a £500 campaign after that expenditure. Profit divided by spending and multiplied by one hundred therefore gives one hundred and fifty per cent, using the specification’s formula. The net £750 must not have the £500 deducted again. An actual evaluation would need to estimate what would have happened without the campaign, distinguish extra profit from extra revenue and state which costs were included. A favourable before-and-after correlation alone would not establish causation.
Sales per region, product or store can reveal where performance differs, but composition matters. Opening a new large store changes total sales without showing whether comparable stores improved. Correlation can describe two variables moving together, with positive or negative direction and differing strength; it cannot determine the direction of a causal influence by itself. Use relevant comparisons and investigate alternative explanations. If C lost share because rivals expanded a new segment, the evidence needed differs from a case where C deliberately restricted low-margin sales near capacity.
The plate contrasts volume growth with declining share and separates revenue from quantities. Its parcels are symbolic and the numerical labels, not the size of decorative objects, carry the comparison. The model asks whether a relative decline matters to C’s actual objective and capabilities. The transfer deliberately changes the market boundary: the apparent seven-point-three-three-per-cent share is not directly comparable with the old ten per cent. Reconstruct a consistent definition or disclose a different metric before making a claim about improvement or decline.
Worked example: Fictional market has 10,000 units in period 1 and 12,500 in period 2. Business C sells 1,000 then 1,100 units. The same defined market and comparable periods are stipulated. Price changes from £20 to £22. A campaign costs £500 and is stipulated to generate £750 additional profit attributable to it after campaign spend; the case explicitly fixes attribution rather than claiming an observational causal estimate.
Business C should investigate its declining relative position, but should not treat loss of share alone as proof of failure. Its unit sales rise from one thousand to one thousand one hundred, giving ten per cent growth. The market rises from ten thousand to twelve thousand five hundred units, giving twenty-five per cent growth. C therefore expands more slowly than the market. Its share falls from ten per cent to eight point eight per cent, a decrease of one point two percentage points, or twelve per cent relative to its original share.
This comparison shows why absolute growth and competitive growth are different. Additional sales can coexist with rivals gaining customers faster. If C’s objective is to establish a stronger market position, that result is a warning. However, a business operating near capacity might deliberately avoid low-margin volume. Market share cannot tell us whether the extra sales are profitable or whether expanding faster would damage service quality. The objective and operational constraint are necessary to interpret the result.
Sales value also changes because price rises from £20 to £22. Revenue increases from £20,000 to £24,200, which is twenty-one per cent growth, despite volume rising only ten per cent. Calling that a twenty-one per cent increase in units would be wrong. An index with the first period set at one hundred gives one hundred and ten for business volume and one hundred and twenty-five for market volume. Those indices make relative changes comparable; they do not imply identical absolute market sizes.
The marketing figure requires equal care. The case stipulates £750 additional profit attributable to a £500 campaign after its expenditure. The specified return-on-marketing-spend calculation is £750 divided by £500, multiplied by one hundred, giving one hundred and fifty per cent. The £750 is already the net profit increment; subtracting the £500 again would double-count the campaign cost. The corresponding increment before that expenditure would be £1,250. The percentage is not a cash balance. In an actual evaluation, attributing profit to a campaign would require evidence about what would otherwise have happened.
I recommend examining where the faster market growth occurred and whether C can serve those customers profitably. If the lost share reflects an attractive segment that rivals have reached more effectively, a targeted response may be justified. If C instead meets its profitability aim while avoiding capacity strain, defending a smaller share can be rational. The figures identify questions and conditional consequences; they do not supply an automatic strategy without context.
Answer: A sustained original evaluated response: apply the stated case, verify the appropriate numerical endpoint, challenge assumptions, compare consequences and justify a conditional decision. No guaranteed business success or official mark/grade is asserted.
Check your understanding: If the reported period 2 market is redefined to include an adjacent product category and becomes 15,000 units, is 1,100/15,000 a valid time-comparable share? Explain and calculate the apparent figure only as a diagnostic.
Answer: It is about 7.33 percent for the redefined period 2 denominator, but comparing it with 10 percent from the old definition confounds business change with boundary change. Reconstruct both periods on the same boundary, or disclose that a different metric is being used. A correct division does not create a valid comparison.
Why: Use the exact stipulated inputs, period, units and denominator; recalculate before judging. Distinguish supported conditional arithmetic from demand, causation, ethics or legal arrangements that the case does not establish.