A portfolio label is the beginning of product judgement
By UK A Level Business · independent study · myAudience
Original myAudience educational illustration. Image: illustration, not a documentary photograph. · myAudience educational illustration; no affiliation with any awarding body.
A portfolio label is the beginning of product judgement
A product is more than its physical contents. Its usefulness may include compatibility, support, reliability, packaging or a service relationship. Product development changes that offer, and therefore affects marketing, operations, people and finance together. A promising idea still needs evidence that customers value the change and that the organisation can deliver it. Sales growth is not enough if development costs or failures undermine the value being created.
The lifecycle model distinguishes development, introduction, growth, maturity and decline. Development can involve costs before sales; introduction may require awareness and distribution; growth may place pressure on capacity; maturity can intensify rivalry; decline may raise questions about adaptation or withdrawal. These are possible commercial conditions rather than compulsory stages with fixed durations. A temporary sales fall, changed market boundary or supply problem does not prove that a product has entered irreversible decline.
Extension strategies attempt to change the situation: advertising can reach new customers, rebranding can change the proposition, lower prices can alter demand, and product adaptation can address a different need. Each strategy has costs and assumptions. Lower prices may raise quantity but reduce contribution; a new name does not repair an unreliable service. Explain the chain from the proposed action to customer behaviour, delivery and financial outcome, then identify evidence that could challenge it.
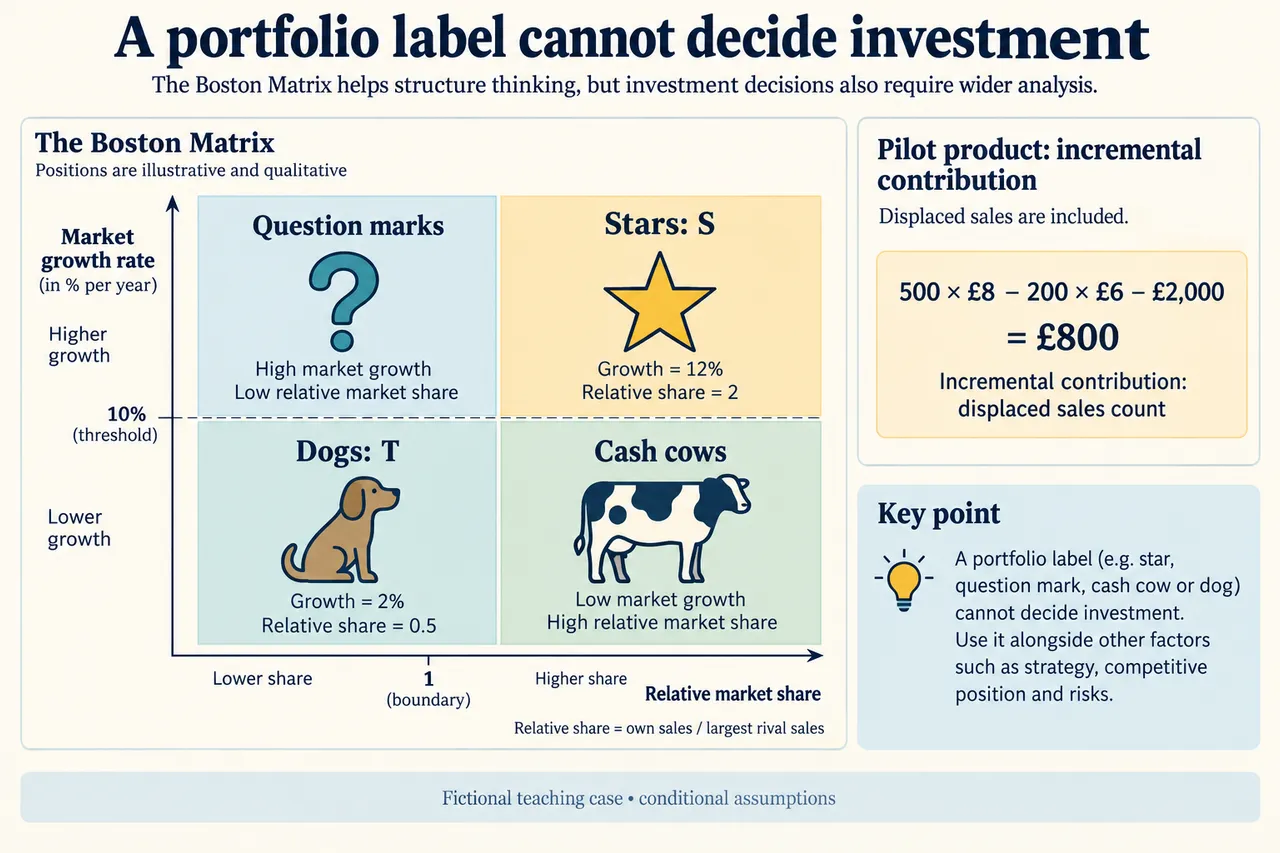
The Boston matrix compares market growth with relative market share. Relative share here means the product's sales divided by those of the specified largest rival, not its percentage of the entire market. S has 2,000 divided by 1,000, or two; T has 1,500 divided by 3,000, or one half. Under the fictional ten-percent high-growth boundary and relative-share boundary of one, S is a star and T a dog. Different definitions could change those classifications.
A star may need resources to retain its position in a growing market; a cash cow combines a stronger share with slower market growth; a question mark raises uncertainty about building share; a dog prompts investigation of a weaker share in slower growth. These labels organise questions rather than establish profitability or prescribe closure. A small product might support a larger offer, serve a specialised need or require little investment. The matrix omits many such relationships.
New development can involve research, design, testing, specialist staff, tooling, launch and support before its eventual outcome is clear. Opportunity cost matters when the same resources could improve an existing service. A pilot may reduce some uncertainty, but it cannot automatically predict a large launch's demand or reliability. Compare the commitment, timing, capability and possible failure costs with the business objective, not just the attractiveness of the new feature.
T's pilot illustrates incremental rather than gross benefits. Five hundred units at £8 contribution give £4,000, leaving £2,000 after a £2,000 pilot cost. If 200 replace existing units earning £6 each, £1,200 of existing contribution is forgone. The incremental outcome is therefore £800. This is displacement of a benefit rather than another cash invoice. A promotional result that counts all pilot sales as new demand would conceal the portfolio trade-off.
Use the concept plate's stated axes and case thresholds to locate S and T, then challenge the recommendation using what the matrix leaves out. Its positions are a qualitative classification, not a physical measurement of the products. A sound judgement combines customer evidence, incremental costs, interdependent products and the possibility of changing market conditions. The purpose is to make resource allocation explainable and revisable, rather than to let a memorable label make the decision.
Worked example: Fictional product S sells 2,000 units; its largest rival sells 1,000 and its market grows 12%. T sells 1,500; its largest rival sells 3,000 and its market grows 2%. Case-defined high-growth and relative-share boundaries are 10% and one. S requests £8,000 development spending; T requests a £2,000 extension pilot.
The firm should use the portfolio matrix to organise investigation, not to decide automatically to close product T and fund product S. S has relative market share of two because its 2,000 units are divided by its largest rival's 1,000. T has relative share of one half because its 1,500 units are compared with 3,000. Under the case's ten-percent high-growth boundary and share boundary of one, S occupies the star category and T the dog category. Those thresholds and market definitions are stipulated, not universal natural laws.
S might require substantial investment to defend its position in a growing market. Calling it a star does not establish that the proposed £8,000 development will generate enough cash or that the firm can execute it. Product development can create design, testing, production and launch commitments before sales appear. A rival response could change both growth and relative share. Managers need a coherent forecast and information about customers, technical feasibility and resources before treating the category as an investment instruction.
T's low-share, low-growth position raises a different question. It could be a genuinely weak product, or it could support another product, serve a valuable specialised need or generate modest cash with little new spending. A lifecycle interpretation also requires evidence: maturity and decline describe commercial conditions, rather than an unavoidable timetable. Advertising, adaptation, rebranding or lower prices should be evaluated according to what changes for customers and what those changes cost.
The £2,000 extension pilot illustrates why incremental analysis matters. Five hundred pilot units at £8 contribution initially appear to produce £4,000, leaving £2,000 after the pilot. If two hundred of those purchases replace existing units earning £6 each, the forgone £1,200 contribution reduces the incremental outcome to £800. Cannibalisation is the displaced benefit, not another supplier invoice. Counting every promoted unit as a wholly new sale would exaggerate the improvement.
I favour a limited T pilot only if the firm can measure genuinely additional demand and contain its commitments. S deserves investigation, but its larger investment should not be approved from the matrix alone. The strongest decision compares incremental cash, operational capacity, product relationships and uncertainty across a consistent period. The matrix helps pose those questions; evidence about the actual portfolio must answer them.
Answer: S has relative share 2 and growth 12%, whereas T has share 0.5 and growth 2%; the stipulated thresholds put them in star and dog quadrants. Those labels alone do not justify investment. The pilot adds £800 after displaced contribution and launch cost; investigate capacity, uncertainty and strategic fit before recommending it.
Check your understanding: T sells 500 pilot units at £8 contribution each, with a £2,000 pilot cost. If 200 replace existing units that earned £6 contribution, what is the genuinely incremental outcome after pilot cost?
Answer: 500 × £8 − 200 × £6 − £2,000 = £800. Cannibalisation is forgone existing contribution, not another cash invoice. A dog label does not make closure automatically optimal: investigate seasonality, product relationships and future costs.
Why: Reconstruct the stated endpoint and consistent denominator. Explain the causal mechanism and compare the missing evidence before recommending action. Fictional arithmetic does not establish actual demand, permissions or ethical justification.