From clicks to customers: digital evidence and CRM
By UK A Level Business · independent study · myAudience
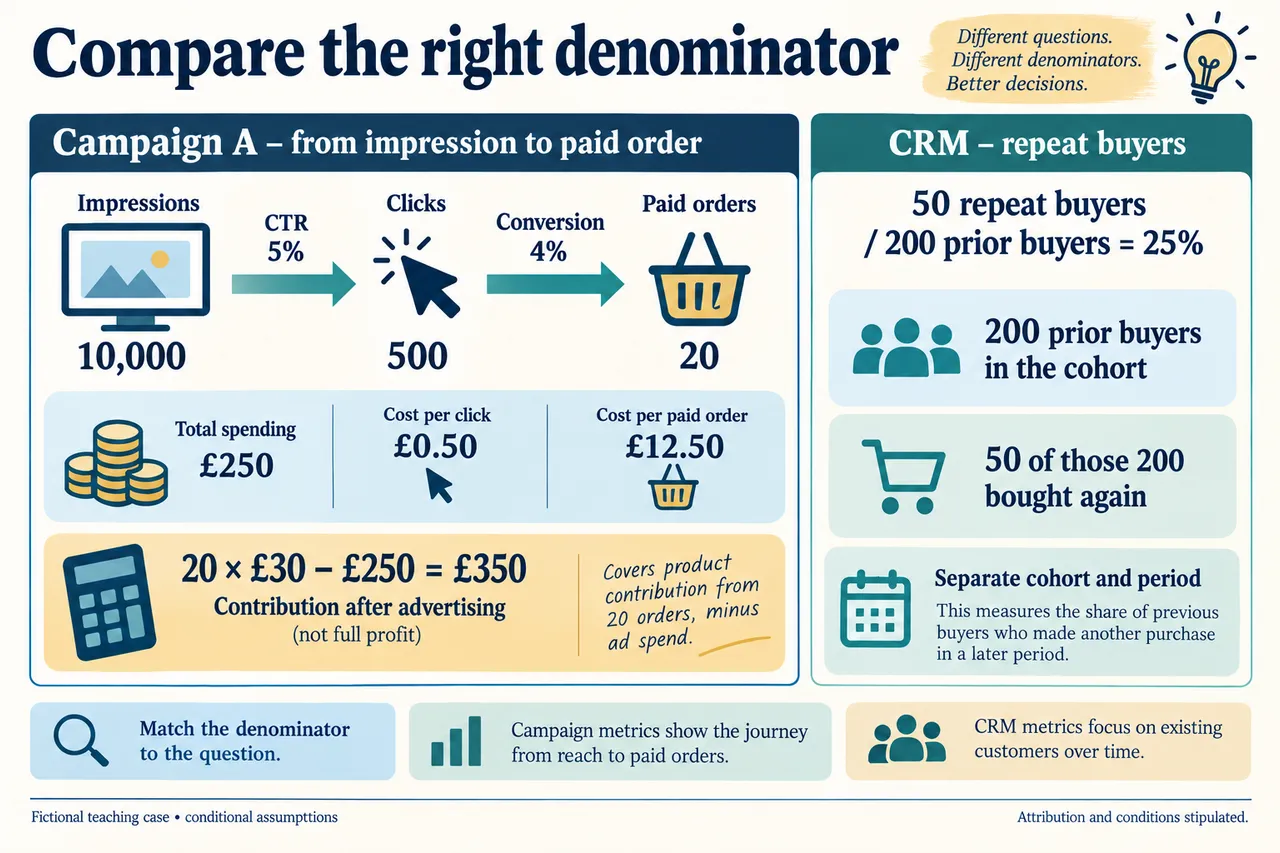
Original myAudience educational illustration. Image: illustration, not a documentary photograph. · myAudience educational illustration; no affiliation with any awarding body.
From clicks to customers: digital evidence and CRM
Digital marketing combines routes for discovery, communication and purchase with methods for recording what happens. Search engine optimisation can improve how a relevant site is found; pay-per-click advertising buys access through paid placements. Neither guarantees a customer or a favourable search position. The business still needs a useful offer and a workable customer journey. Tools and platforms are means of pursuing an objective, not an objective in themselves.
Measures need clear units and endpoints. An impression is an exposure event, and one person may produce several. A click is not necessarily a completed visit, enquiry or purchase. Users, subscribers and orders describe different populations. Specify the time period, eligible traffic and outcome before calculating rates. Otherwise, a change in counting rules can create an apparent performance change without any improvement in what customers experience.
The fictional A campaign records 10,000 impressions and 500 clicks, giving five-percent click-through. Twenty paid orders from 500 clicks give four-percent conversion. With £250 spend, the cost is £0.50 per click and £12.50 per paid order. Twenty orders at £30 contribution give £600; £350 remains after advertising. This is a stated contribution calculation, not full profit, and attribution is stipulated rather than proved by the presence of a tracking label.
B records 20,000 impressions, 600 clicks and 18 orders with £300 spend. Its click-through and click-to-order conversion rates are each three percent, while contribution after advertising is £240. More impressions and clicks therefore accompany fewer orders and a lower immediate result. This illustrates why a metric should be selected for its connection to the business purpose rather than for how impressive its absolute value appears.
Time spent on a site and search performance provide clues rather than self-explanatory success. Long dwell can indicate engagement, but it can also reflect confusion, inaccessible navigation or difficulty checking a price. A shorter visit may be useful if someone finds exactly what they need. To interpret these measures, connect them to the task, customer feedback and completed outcomes. Observing a sequence does not establish what caused it.
Customer relationship management coordinates acquisition, retention, lead generation and the pipeline from enquiry to a fulfilled relationship. In the separate fictional cohort, 50 repeat purchasers among 200 prior buyers give a twenty-five-percent repeat rate for that period. This is not the four-percent campaign conversion rate. Consistent records and explicit stages help staff support customers, but inaccurate or excessive data can create mistakes and undermine trust.
Analytics can identify patterns, and AI can support predictions or recommendations, but these depend on suitable data, validation and correction. A model may mistake a repeated exposure for broad interest or reproduce a biased historical choice. Predictions do not supply missing permission or establish a lawful purpose. Current ICO guidance distinguishes the intended activity, information used and relevant rules; an electronic receipt request does not by itself authorise promotional messages. This is a bounded educational distinction, not a complete compliance recipe.
The plate makes A's funnel and denominators explicit, with advertising costs separate from contribution. Judge performance using comparable audiences, definitions and periods, then investigate incrementality through a suitable test. Keep fair, transparent treatment and the applicable permissions as constraints, even when a metric improves. Digital competitiveness depends on useful service and reliable evidence, not on collecting every available signal or treating an uncertain prediction as knowledge about a person.
Worked example: A fictional PPC campaign records 10,000 impressions, 500 clicks and 20 paid orders. Spending is £250; contribution is £30 per paid order. The stages share an explicit campaign scope, but causality is not established. In a separate CRM cohort, 50 of 200 prior buyers purchase again.
Campaign A appears more effective on the stipulated immediate financial measures, but the manager should first verify that both campaigns use comparable definitions and attribution. Five hundred clicks from ten thousand impressions give a five-percent click-through rate. Twenty paid orders from those clicks give a four-percent conversion rate. The £250 spend implies £0.50 per click and £12.50 per paid order. Twenty orders at £30 contribution produce £600; deducting the advertising spend leaves £350 before other omitted costs.
Campaign B produces six hundred clicks from twenty thousand impressions, so its click-through rate is three percent. Eighteen paid orders from six hundred clicks also give three-percent conversion. At £300 spend, its stipulated net contribution is £240. B reaches more impressions and records more clicks, yet produces fewer orders and a lower result. A headline count can therefore favour the wrong campaign if the objective concerns fulfilled purchases rather than exposure.
These calculations do not prove causality. Impressions may include repeated exposures to the same people, while an attributed order might have occurred without advertising. Comparing different periods or audiences would weaken an inference that campaign design caused the difference. A credible test should define its endpoint, identify the eligible population and consider a comparison group where appropriate. Time on a site could indicate interest, but it could also reflect confusion or an inaccessible checkout.
CRM adds another layer. Fifty repeat purchasers among two hundred defined prior buyers give a twenty-five-percent repeat rate for that cohort and period. It is not the campaign conversion rate, and it cannot be combined with clicks to create an overall percentage. A pipeline should distinguish enquiries, qualified leads, orders and completed service. Accurate, proportionate records can support follow-up and learning, but automated predictions can reproduce poor data or make uncertain recommendations appear authoritative.
I would prefer A only after checking comparable attribution, fulfilment and the quality of its customer experience. The firm must also respect purpose, transparency and the applicable permissions for its marketing activity. A prediction or a long visit does not create consent, and an electronic receipt request does not by itself authorise promotional messages. Commercial effectiveness and fair treatment are separate constraints: a campaign that improves a metric while misusing information is not a sound recommendation.
Answer: Campaign A has a 5% click-through rate and 4% click-to-order conversion, costing £0.50 per click and £12.50 per paid order. It leaves £350 contribution after advertising, versus £240 for B under the stipulated attribution. The separate CRM figure is 50 repeat buyers out of 200 prior buyers, or 25%; use matching periods and lawful, proportionate data before drawing a broader conclusion.
Check your understanding: Campaign B has 20,000 impressions, 600 clicks, 18 orders and £300 spend. Compare click-through, click conversion and contribution after advertising. Why do dwell time and AI predictions establish neither permission nor incrementality?
Answer: B click-through is 3%; click conversion is 3%; 18 × £30 − £300 = £240. Definitions and attribution conditions must match. Dwell can reflect confusion, while predictions may be systematically wrong. Fair, transparent use and applicable permissions are separate constraints; neither proves that advertising caused a purchase.
Why: Reconstruct the stated endpoint and consistent denominator. Explain the causal mechanism and compare the missing evidence before recommending action. Fictional arithmetic does not establish actual demand, permissions or ethical justification.