Proxy evidence: reconstructing with a calibration
By UK A Level Environmental Science · independent study · myAudience
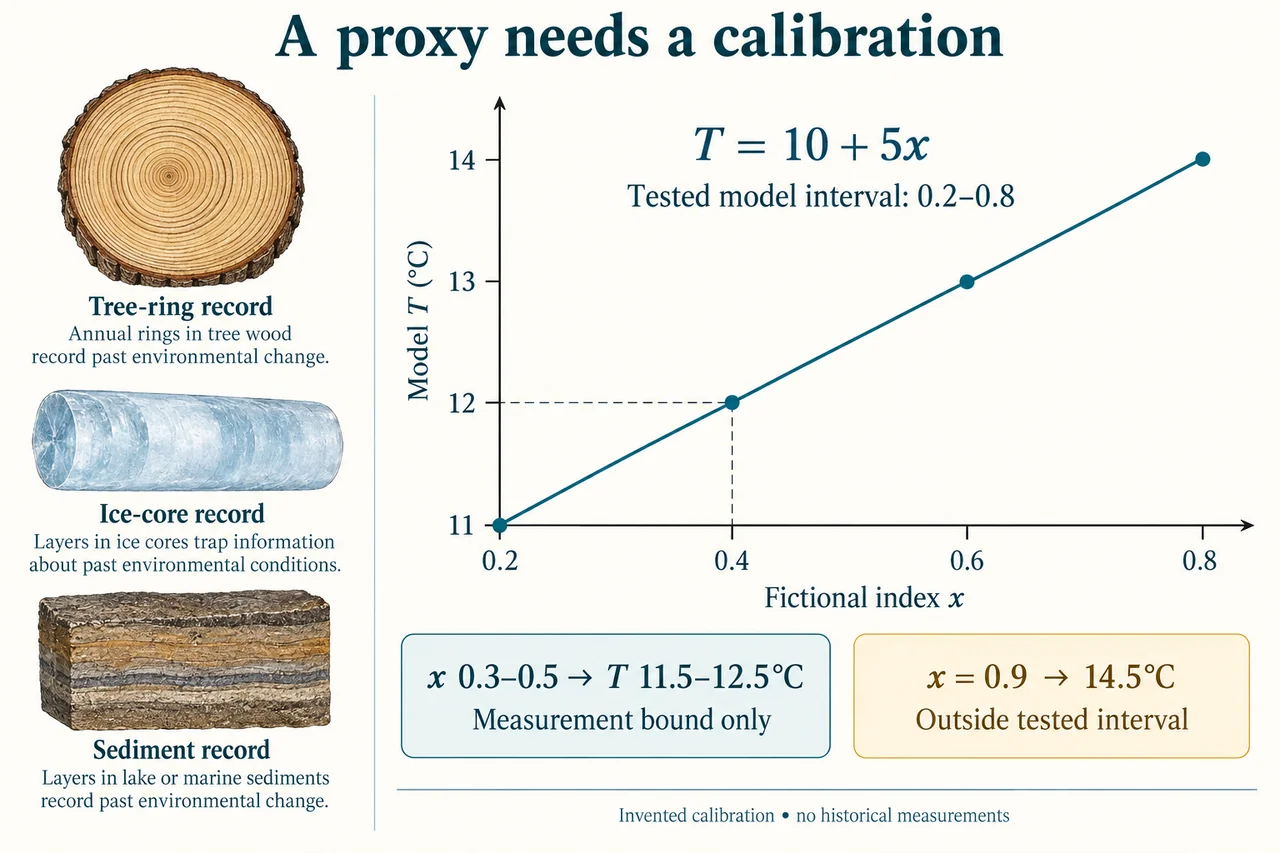
myAudience original educational concept illustration. Image: illustration, not a documentary photograph. · Original generated educational concept plate with retained actual prompts, receipts and rejected predecessors; no third-party logos or measured data.
Proxy evidence: reconstructing with a calibration
A thermometer records a temperature at the time and place of measurement. A climate proxy is different: it is a measurable feature that contains indirect information about earlier conditions. Tree-ring widths, ice-core chemistry and sediment contents can preserve useful signals, but interpreting those signals requires a relationship between the measured feature and the environmental variable of interest.
The NOAA paleoclimatology archive brings together several kinds of natural records and reconstructed variables. Its tree-ring collection includes width, density and isotope measurements, showing why “a tree ring” is not one universal instrument with one calibration. Site conditions, species and the property measured matter. Agreement between independent proxy types can strengthen an interpretation without making their uncertainties disappear.
Calibration links a proxy measurement to conditions known independently, commonly during an overlapping observation period. The resulting relationship must be checked rather than assumed to work identically everywhere and at every past date. A ring-growth change could reflect water availability, competition or disturbance as well as temperature. Confounding mechanisms are especially important when the variable that limited growth changes through time.
For an original numerical example, choose a dimensionless proxy index x and a teaching calibration T = 10 + 5x, with T in°C. Assume this relationship has been tested only over 0.2≤x≤0.8. At x = 0.4 it returns 12°C. The slope is 5°C per index unit and the intercept is 10°C. This is invented arithmetic, not a NOAA reconstruction or a claim that a real tree-ring index follows that equation.
If a chosen measurement is bounded by 0.3≤x≤0.5, substituting the endpoints gives 11.5≤T≤12.5°C. The result propagates only the stated index-measurement bound through a fixed linear equation. It is not a confidence interval that includes calibration error, dating uncertainty or environmental confounding. Unspecified errors cannot be silently assigned a numerical range, and a narrow arithmetic interval alone does not establish a precise historical climate.
At x = 0.9 the equation produces 14.5°C, but this lies outside the declared calibration domain. The arithmetic can be correct while the inference is unvalidated. A responsible analyst would seek additional calibration evidence, compare other records and examine why the new index value arose. Extending a straight line is a model choice, not proof that the physical relationship remains linear.
The plate places a clearly fictional calibration alongside separate tree-ring, ice-core and sediment icons. These icons identify kinds of evidence; they do not imply that all three share the same numerical relationship. The graph marks the tested interval and the x = 0.4 reading. A measurement-bound card explains 11.5–12.5°C while an out-of-domain marker identifies extrapolation. No curve is presented as actual past temperature observations.
Proxy research informs decisions about long-term variability and human influence, but conclusions should match the available resolution and coverage. Seasonal evidence at one site cannot automatically establish an annual global average. Publishing the calibration, dating method and exclusions allows others to challenge the inference. The strongest explanation combines mechanisms, independent records and explicit uncertainty instead of treating either a beautiful core photograph or a computed decimal as conclusive evidence.
Worked example: Evaluate two reports using the invented calibration T = 10 + 5x, tested only from x = 0.2 to 0.8. Report A calls x = 0.4±0.1 “an exact historical 12°C”. Report B calls x = 0.9 “validated 14.5°C”.
I separate the observed proxy index, the chosen calibration and the environmental interpretation. Report A’s central arithmetic is correct:10 + 5 × 0.4 = 12°C. However, the supplied measurement bound means x could lie from 0.3 to 0.5. Substituting these endpoints into the same monotonic equation gives 11.5°C and 12.5°C. An exact 12°C description discards the declared measurement uncertainty.
That interval is narrower in scope than a total historical uncertainty estimate. Its half-width is 0.5°C because the fixed slope multiplies the 0.1 index bound. It assumes the slope and intercept are exact and the relationship applies to this sample. Calibration uncertainty, dating error, site-specific influences and non-temperature effects have not been assigned values. I cannot invent their magnitudes or describe the result as a statistical confidence interval without a probability model.
Report B also performs a valid substitution:10 + 5 × 0.9 = 14.5°C. The problem is the word “validated”. The declared evidence tests the relationship only from 0.2 to 0.8. A value of 0.9 requires extrapolation beyond that domain. A correct calculation does not establish that the biological or geochemical response remains linear at that value, especially if another environmental factor changes its influence.
The relevant evidence would include the calibration observations, independent temperature measurements, sample dating and conditions that might affect the proxy. Matching records from other sites or proxy types could help distinguish a local influence from a broader environmental signal. They would need appropriate time alignment and resolution; apparent disagreement could arise from different seasons or locations rather than one record simply being wrong.
My bounded conclusion is therefore that Report A supports a central model estimate of 12°C with a measurement-only range 11.5–12.5°C, not an exact historical temperature. Report B supplies an extrapolated numerical estimate of 14.5°C, not a validated reconstruction. Neither arithmetic result settles the real history because all values in this task are fictional and the external validation evidence is unspecified. I would report those distinctions explicitly, retain the original proxy observations and avoid inventing an expanded uncertainty range or a historical event to make the interpretation look complete.
Answer: A yields 12°C with a measurement-only 11.5–12.5°C range under the fixed equation, not an exact reconstruction. B’s 14.5°C is an extrapolation outside the tested domain, so “validated” is unsupported.
Check your understanding: Another invented proxy model is T = 8 + 4x, tested over 0.25≤x≤0.75. A measurement lies between 0.45 and 0.55. Find the predicted temperature range and explain whether it includes dating error. What changes if x = 0.8?
Answer: The endpoints give 9.8 and 10.2°C. That range includes only the supplied x bound through a fixed equation; no dating-error magnitude was provided. At x = 0.8 the equation gives 11.2°C, but that is outside the tested domain and must be described as extrapolation, not a validated reconstruction.
Why: Use the declared boundaries, units, fictional values and assumptions; evaluate alternatives and specify missing evidence. These original practice tasks do not establish independent assessed mastery or first-hand practical completion.